
ProRx client user story
End-to-end walkthrough with screenshots, capabilities, and limitations (demo build)
Clarix — User story for ProRx Pharma
Clarix is a 503B operations platform: digital batch records, inventory traceability, formulas, quality workflows, and facility support modules. This document explains what each area does, honest limits of the current software, and pairs that with 39 numbered screenshots taken from a working demo so leadership and operations share the same picture before rollout.
The end-to-end picture (what happens in the business)
Operationally, product moves from material identity to released batch in a single chain. Raw materials are defined as inventory items; each receipt is a lot with quantity, status (for example quarantined until released), and expiry. A master formula locks the recipe: which items appear on the bill of materials (BOM), theoretical amounts, and the ordered manufacturing steps. A batch is one execution of that approved formula with a unique batch number: the shop floor completes steps, issues actual quantities from released lots onto the batch (full material trace), may log QC samples, and advances the record through QA review and PIC release until the batch is released. Around that spine, environmental monitoring, equipment status, training, controlled documents, deviations, and CAPA provide the evidence and governance expected in a compounding facility.
What Clarix does not replace by itself: it is not your full ERP, warehouse robotics, purchasing contract system, or commercial LIMS. Outbound distribution (pick/pack/ship to hospitals, carrier integration, delivery paperwork per shipment) is not modeled end-to-end in this product generation---release here means manufacturing / quality release of the batch record, not necessarily truck-level logistics. A live production deployment also requires your own validation, SOP alignment, and master data migration; the screenshots use demo data to illustrate behavior, not your live product catalog.
What this document shows
The sections below follow the same order as the walkthrough capture: dashboard and operations metrics, then inventory, formulas, batches (including multiple lifecycle states), production, lab, quality, environmental, equipment, training, documents, notifications, reports, personal settings, administration, the same batch viewed as different job roles, and finally screens to create a new formula and a new batch. Each section states what the software is doing, where it stops, and which figure numbers apply.
Contents
- Operations dashboard --- Figures 1
- Inventory --- Figures 2--3
- Master formulas --- Figures 4--5
- Batches (EBR) --- Figures 6--10
- Production --- Figure 11
- Lab --- Figures 12--13
- Quality (deviations & CAPA) --- Figures 14--16
- Environmental --- Figures 17--18
- Equipment --- Figures 19--20
- Training & documents --- Figures 21--23
- Notifications --- Figure 24
- Reports --- Figures 25--28
- User settings --- Figure 29
- Administration --- Figures 30--34
- Role-based views --- Figures 35--37
- New formula & new batch --- Figures 38--39
1. Operations dashboard
What it does: Aggregates batch counts by lifecycle stage (for example in progress, pending QA, awaiting PIC, released, drafts), surfaces formula and inventory health signals, and lists recent batches so managers see backlog and flow at a glance.
Limitations: Read-only rollups from current data; not a substitute for financial forecasting or MRP. Tiles reflect what is in the database---empty orgs show zeros. Deep drill-down is through the linked modules (batches, inventory), not infinite dashboard customization in this build.
Figures 1: Landing overview after sign-in---how the demo facility summarizes operational load.
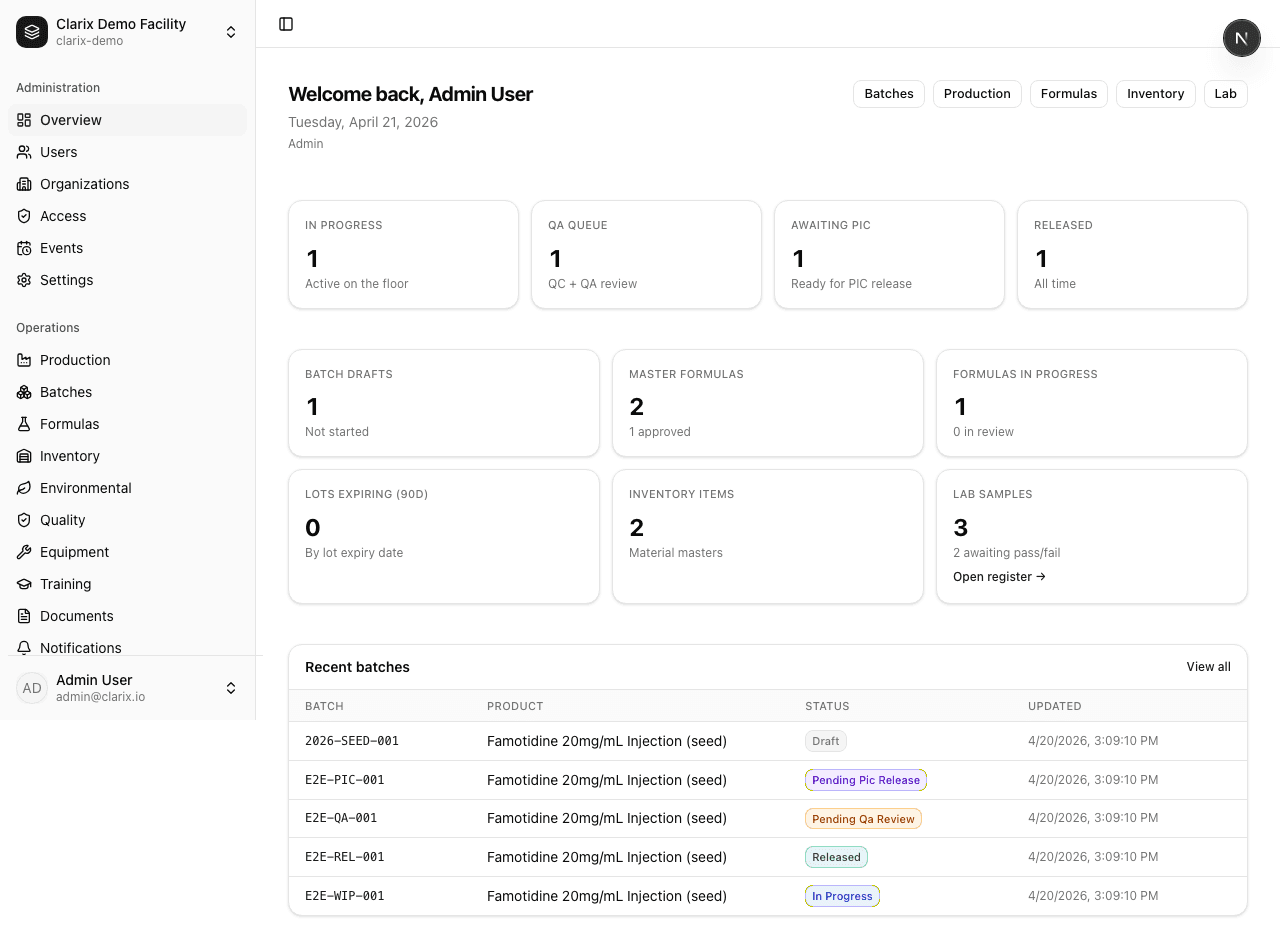
Figure 1. Operations overview.
2. Inventory (material masters and lots)
What it does: Maintains material masters (SKU, category, default unit), lot-level inventory (received quantity, remaining, status, dates, optional barcode), receipts, and issues---especially issues to in-progress batches so every gram ties to a batch line. Receiving creates lots; quarantined lots cannot be issued until released per your process.
Limitations: Not a full WMS (no bin-level directed putaway, wave picking, or carrier APIs). Barcode use is as modeled in the app---no guarantee of shop-floor hardware integration until you configure devices and procedures. Multi-facility transfer workflows may need process outside the tool if not explicitly built.
Figures 2--3: Catalog of items, then drill-down to one item's lots and transaction history.
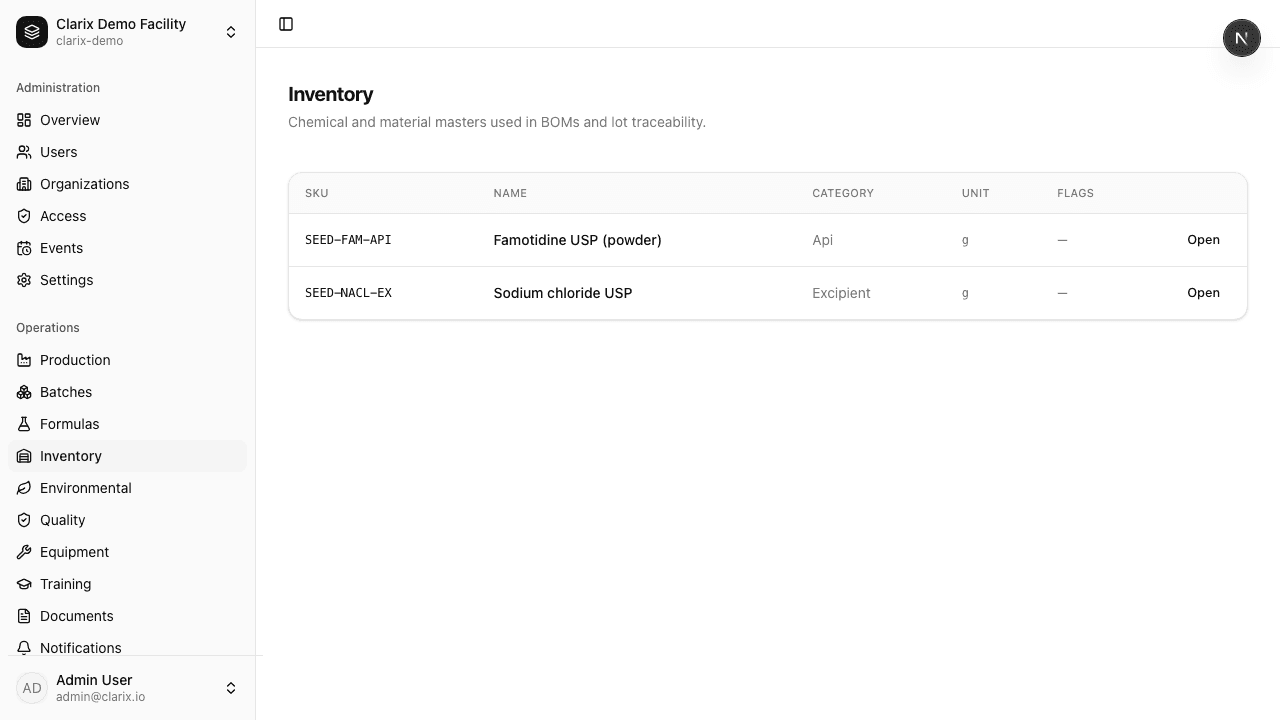
Figure 2. Material masters.
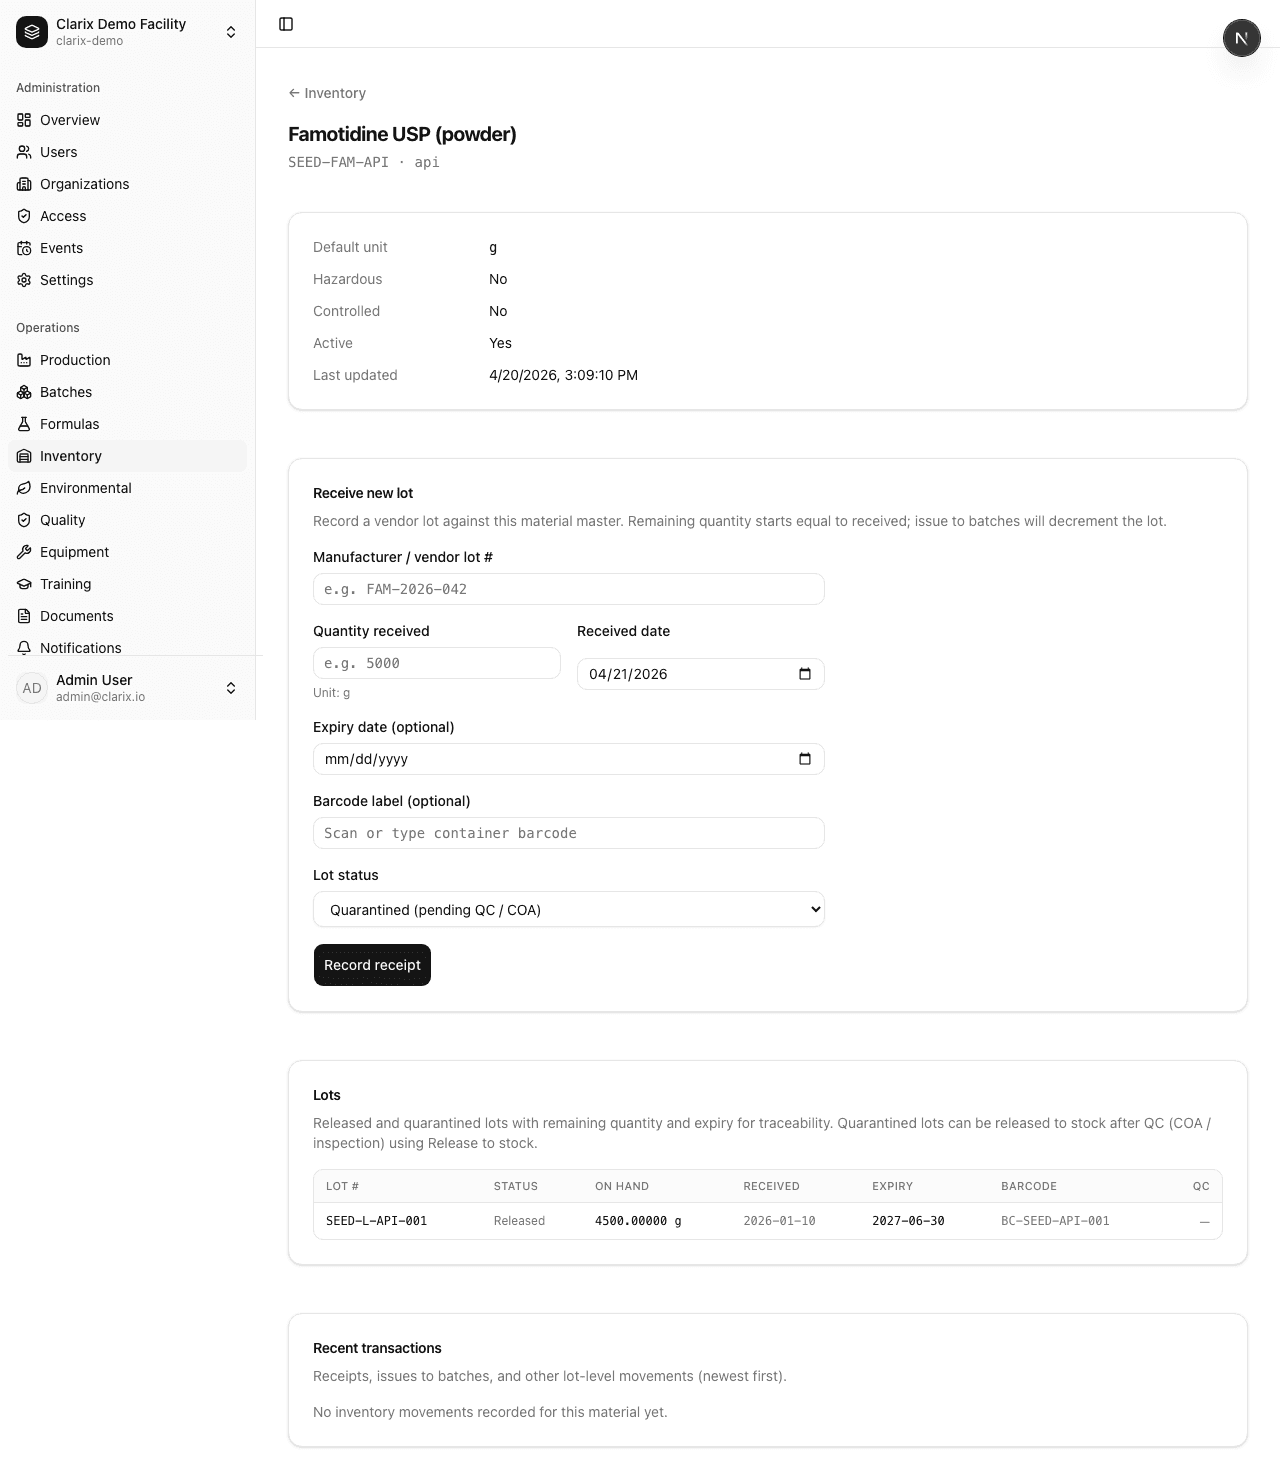
Figure 3. One item: lots and movements.
3. Master formulas
What it does: Stores versioned master formulas with status (draft through approved), BOM lines pointing at inventory items, and ordered manufacturing steps. Approval gates control which formulas can spawn batches. Edits to drafts go through your defined review path before production use.
Limitations: Scale-up/down rules and complex pharmaceutical physics are only as complete as the fields and validation you configure---not every edge case from paper MFs is automated. Formula approval roles are enforced in software but must match your quality agreement and job descriptions.
Figures 4--5: Filterable catalog; approved example formula with BOM and steps.
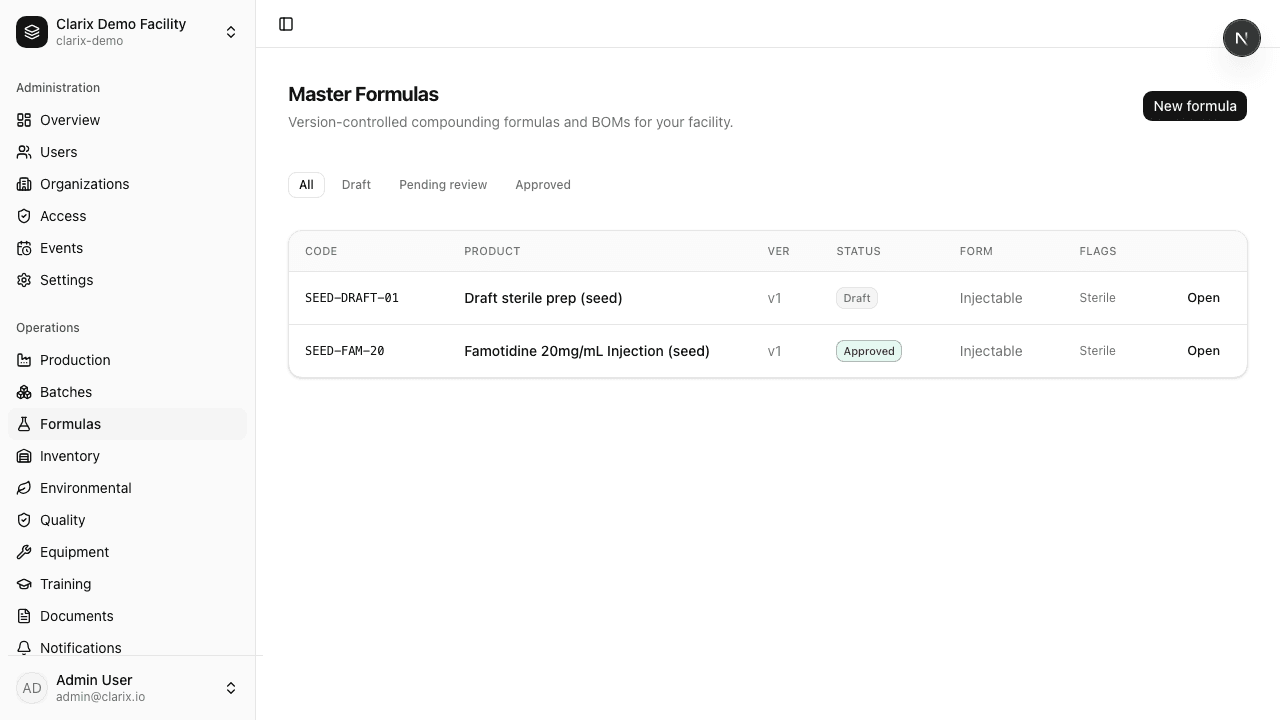
Figure 4. Formula catalog.
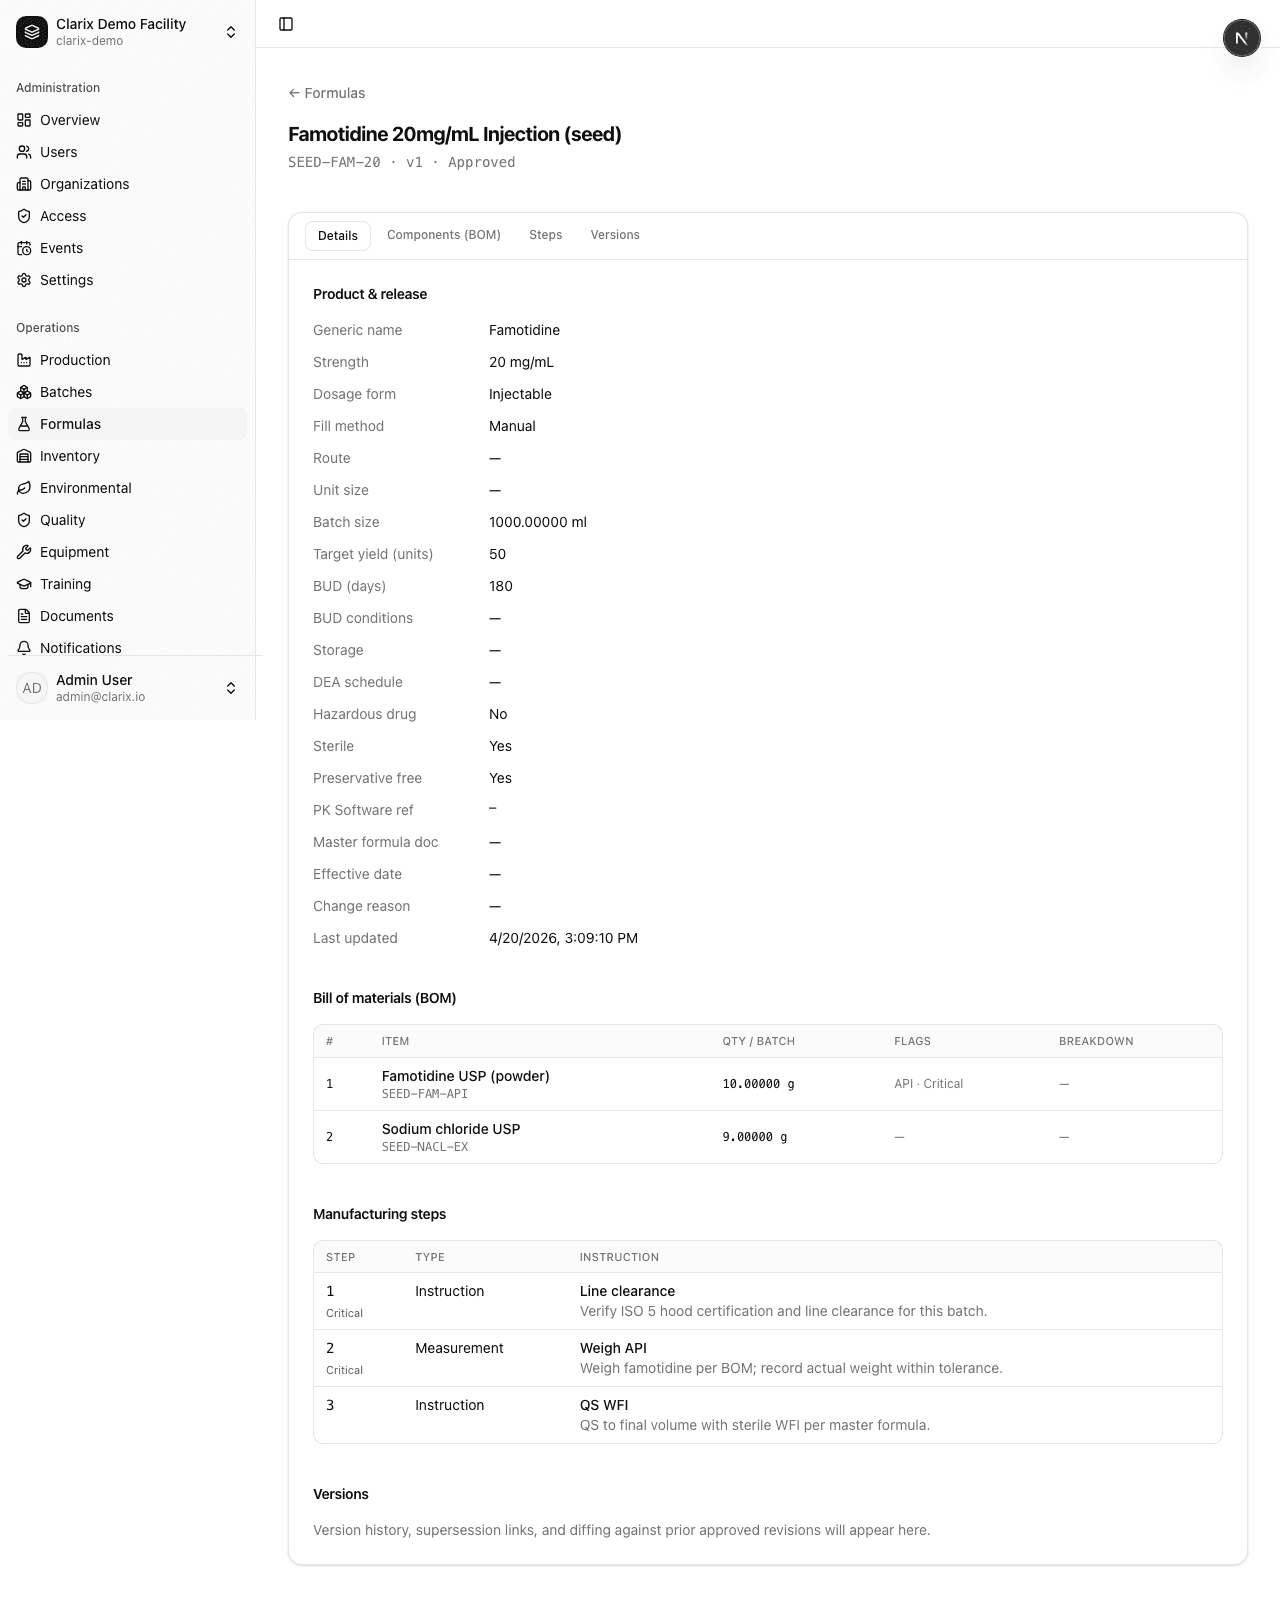
Figure 5. Formula detail: BOM and steps (demo product).
4. Batches --- electronic batch records
What it does: Creates a batch from an approved formula, assigns a unique batch number, tracks status through execution, QA, and PIC release, records step completion with e-sign (facility PIN), ties actual component usage to specific lots, supports lab sample links, deviation/CAPA references, void/recall with justification where applicable, and preserves a history timeline. Batch URLs accept human batch numbers (not only internal IDs) for sharing.
Limitations: iPad/offline execution depth depends on deployed modules; web focus here. Review-by-exception and some analytics are still evolving. Distribution after release is not tracked as ship-to-customer logistics in this scope. Electronic signature legal interpretation follows your validation, not the screenshots alone.
Figures 6--10: List; then the same pipeline illustrated with demo batches---work in progress, QA queue, PIC queue, and released.
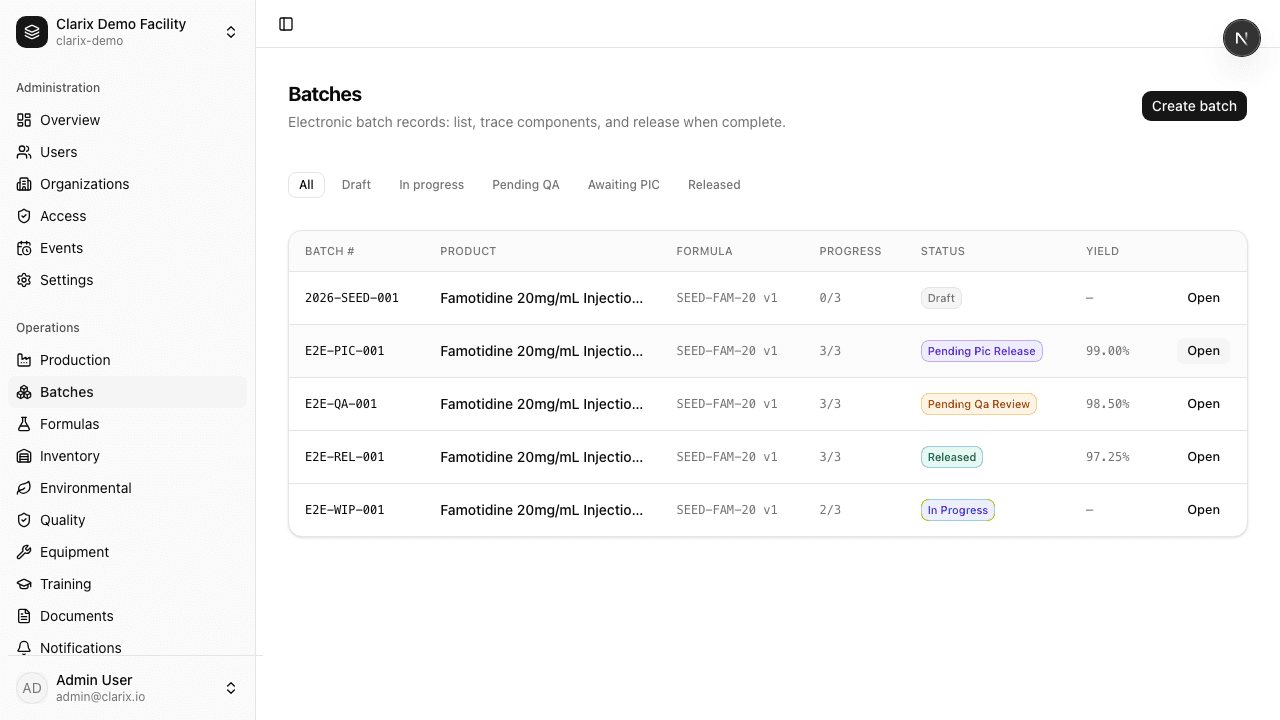
Figure 6. Batch list and filters.
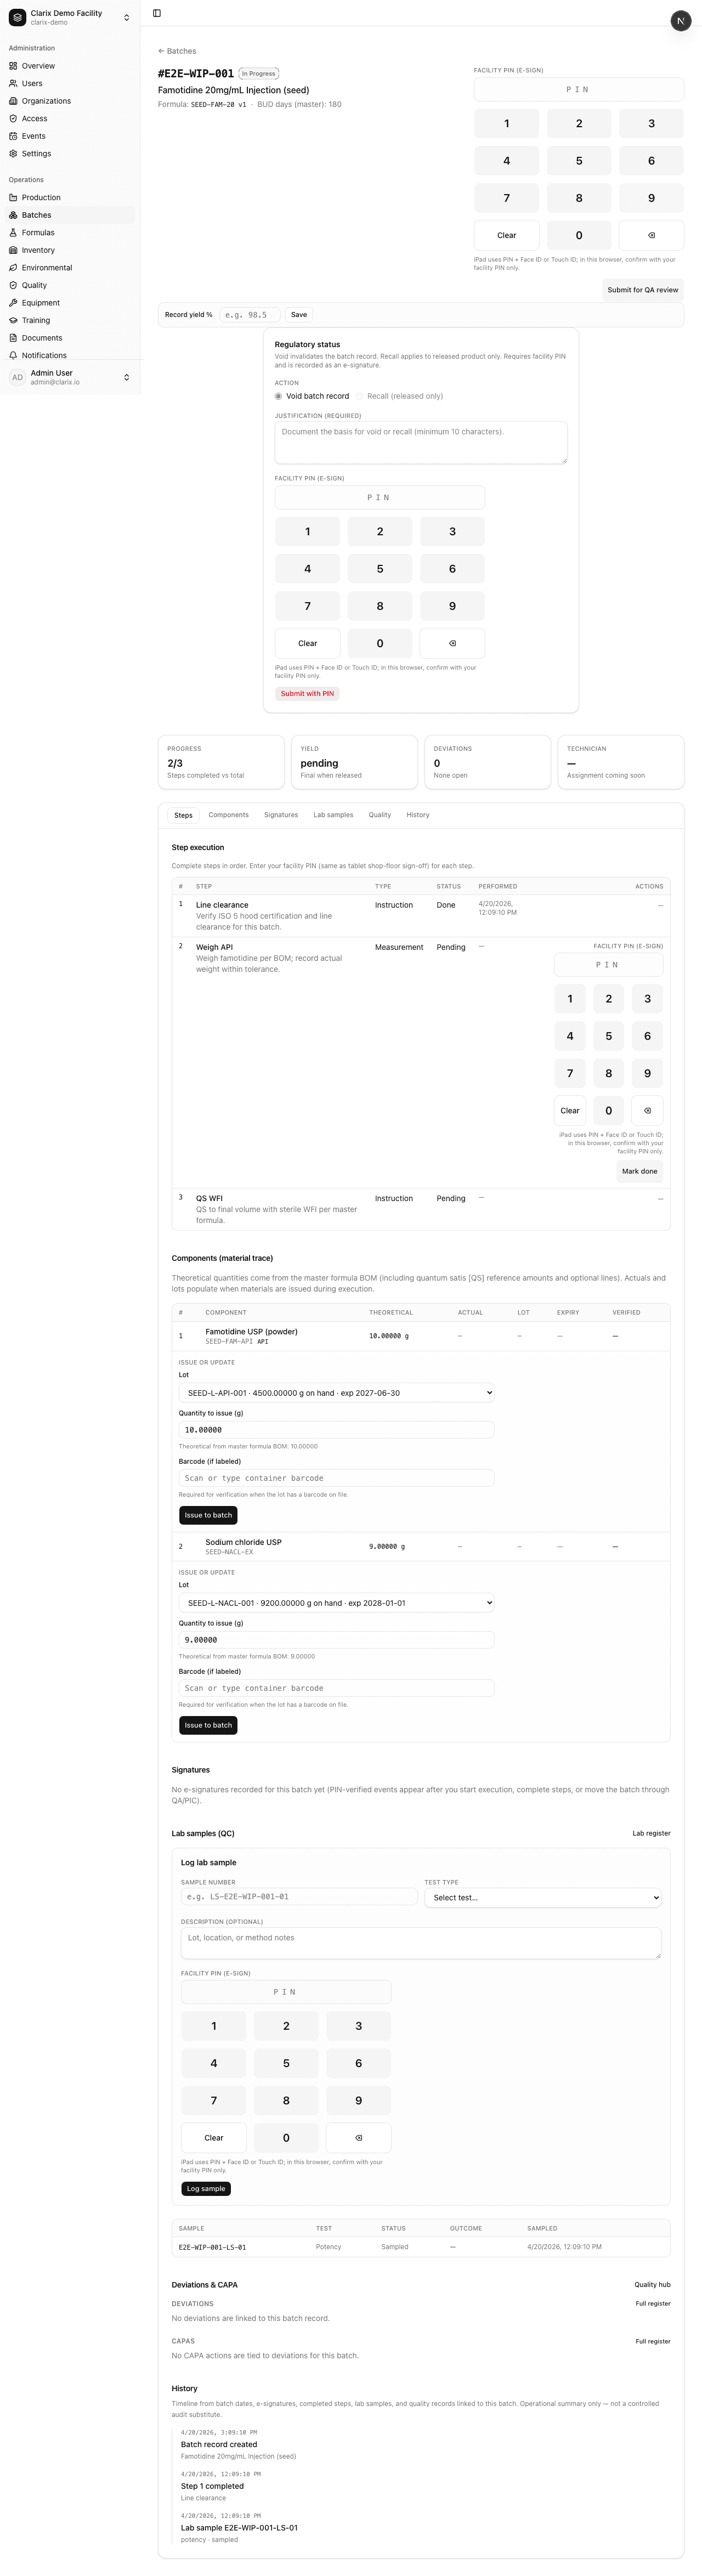
Figure 7. In progress --- steps and material trace.
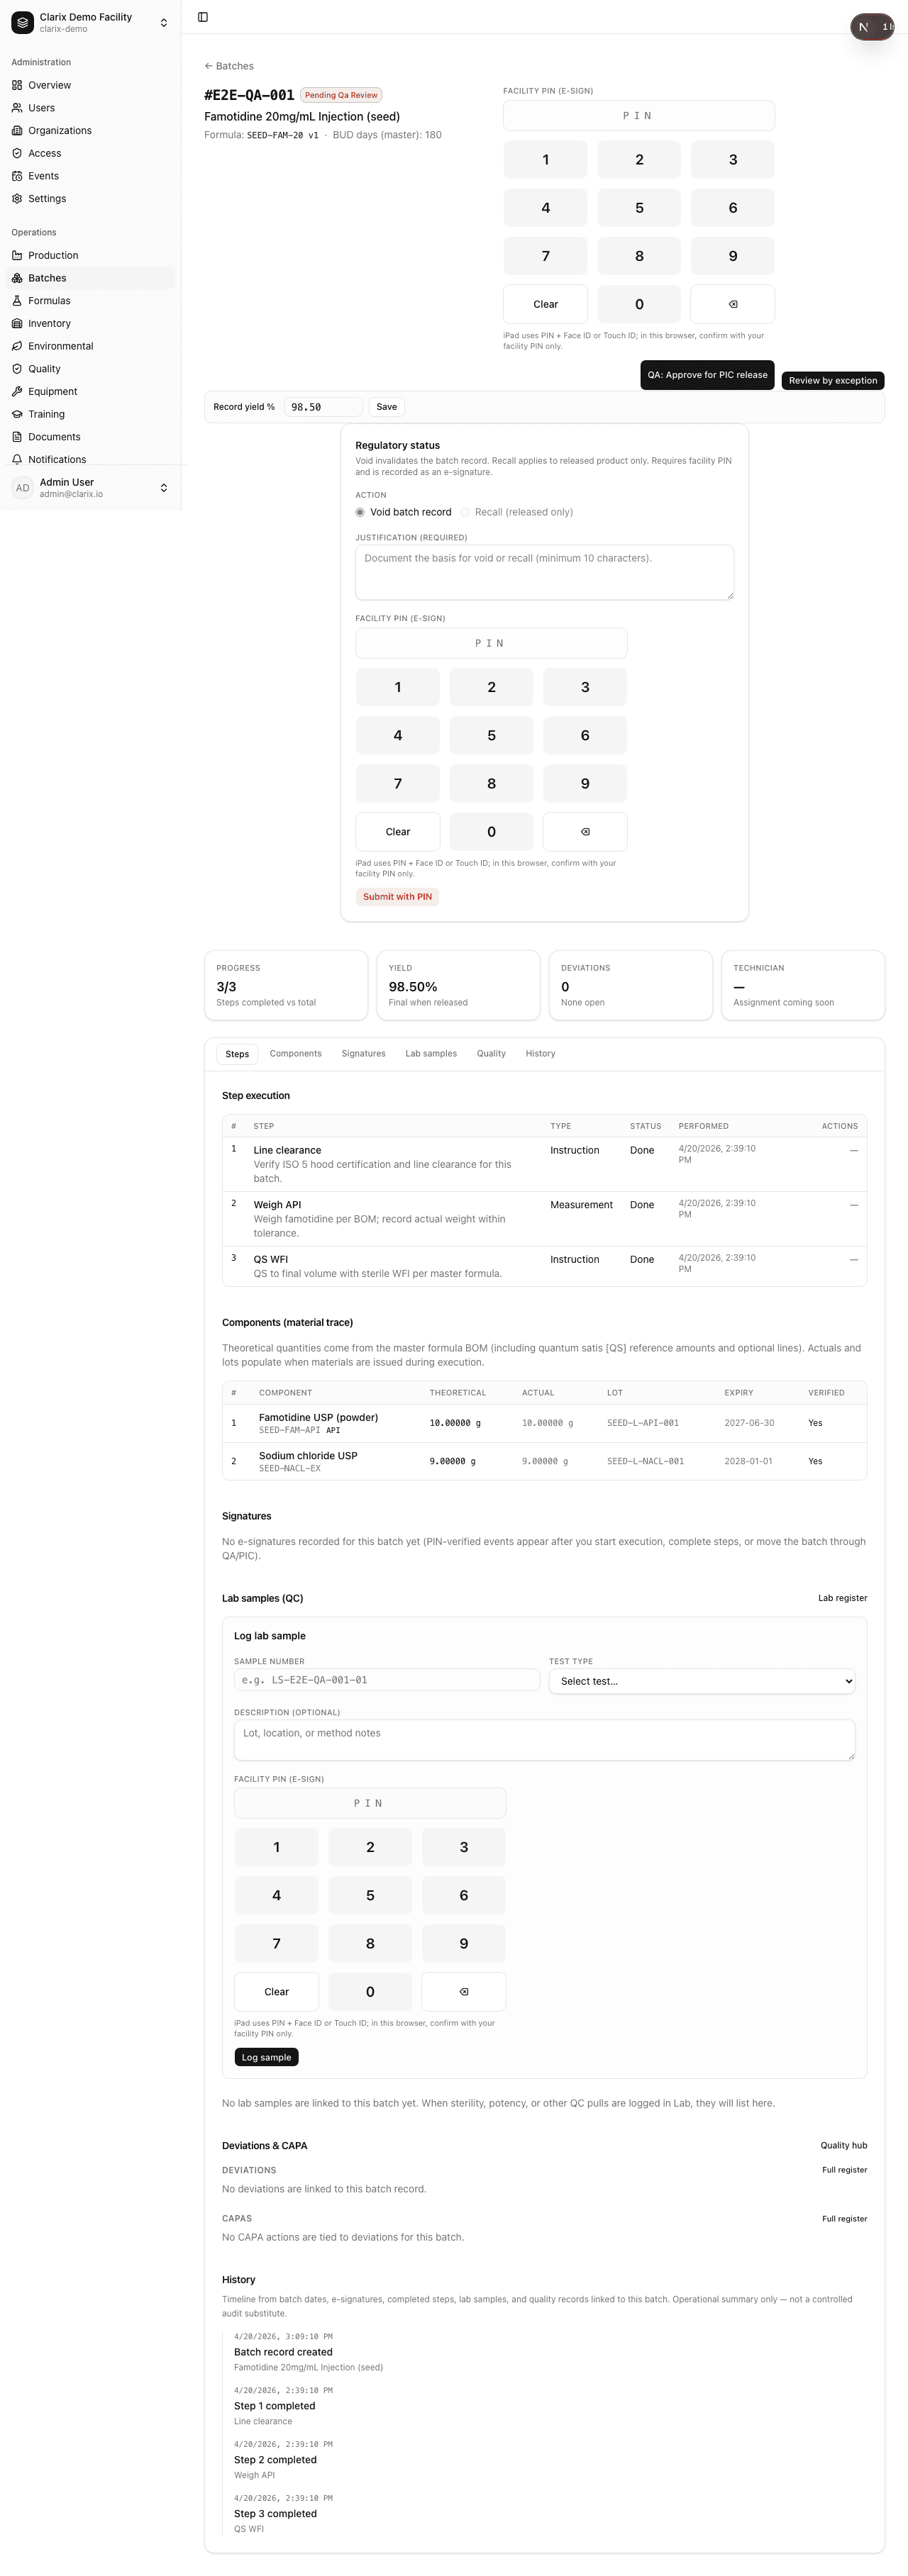
Figure 8. Pending QA review.
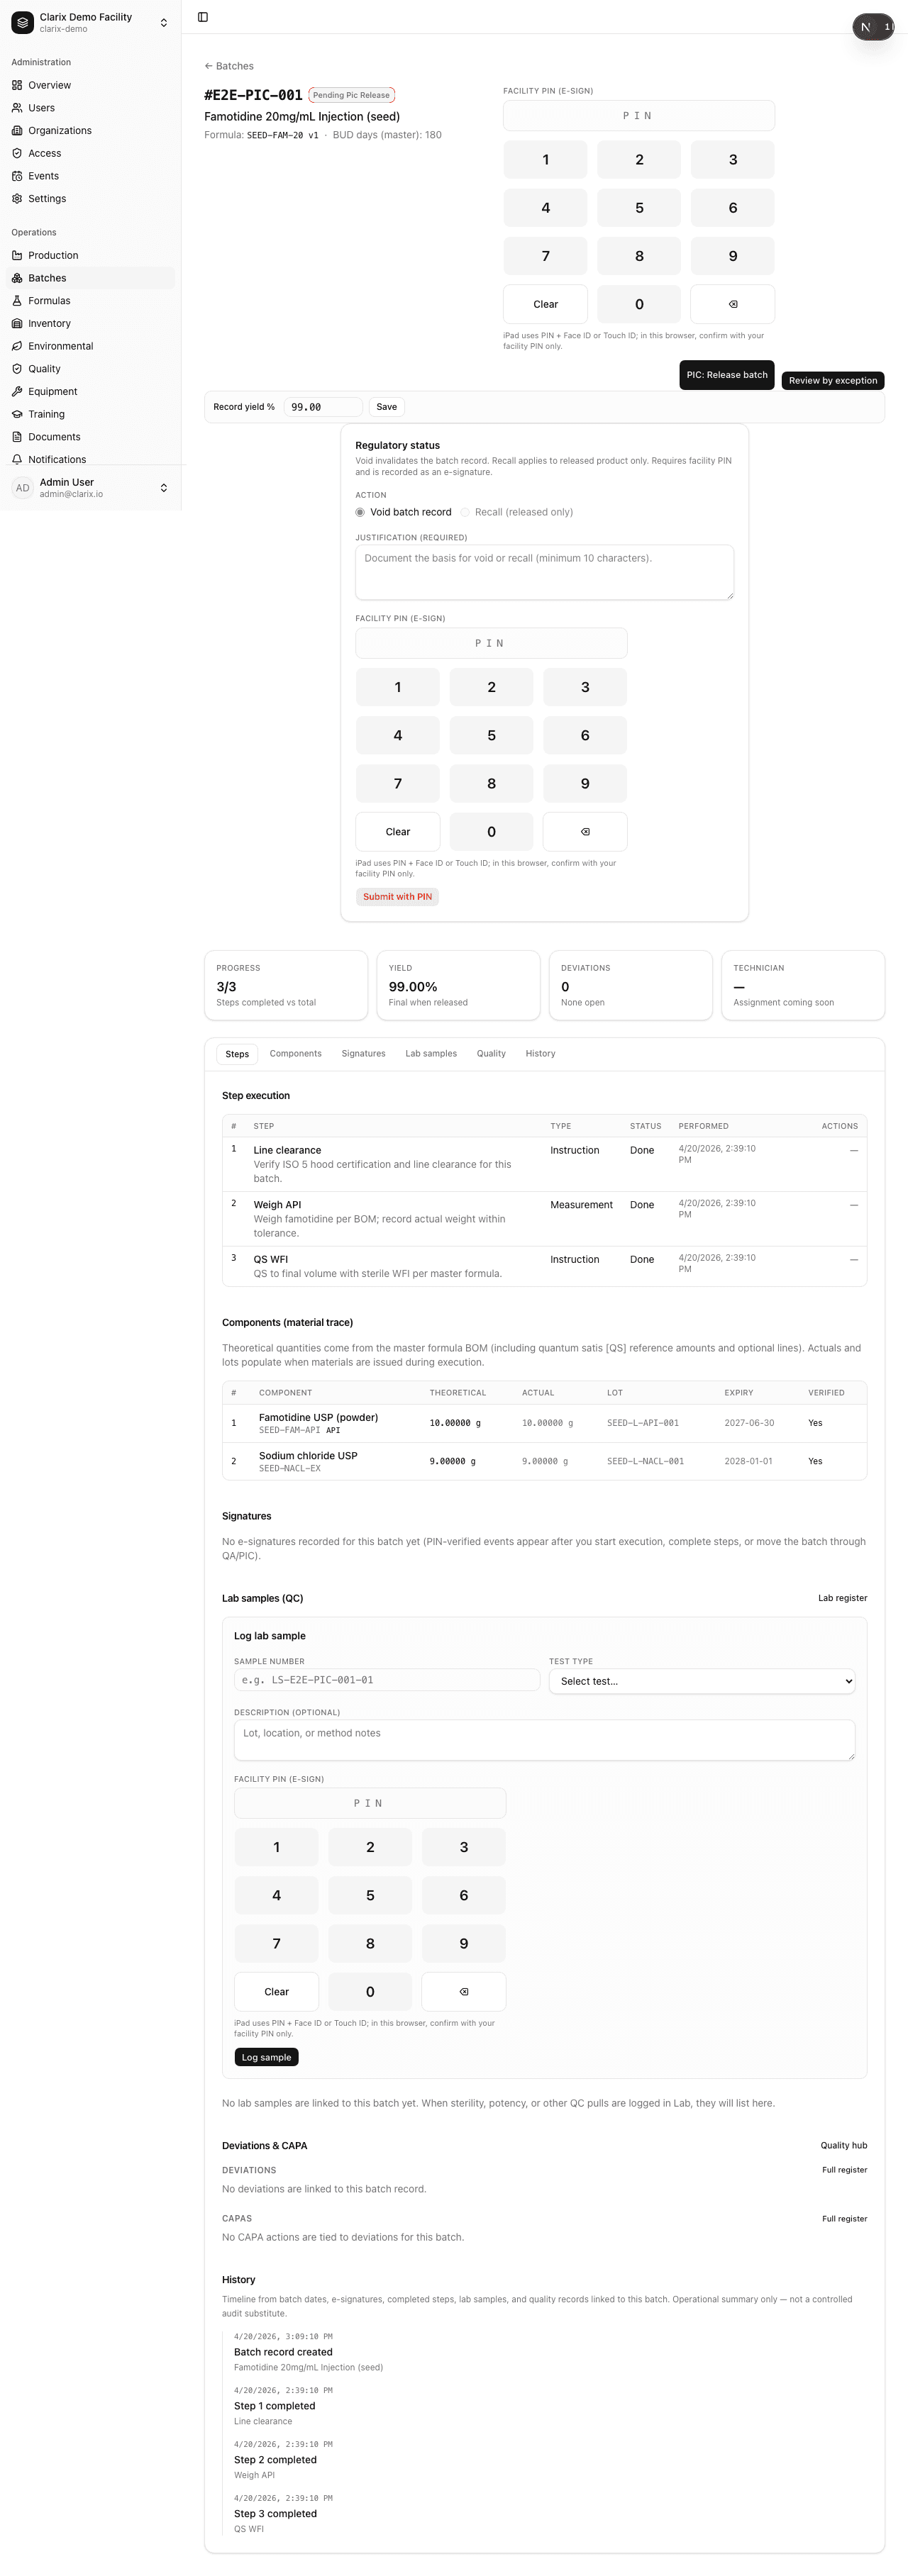
Figure 9. Awaiting PIC release.
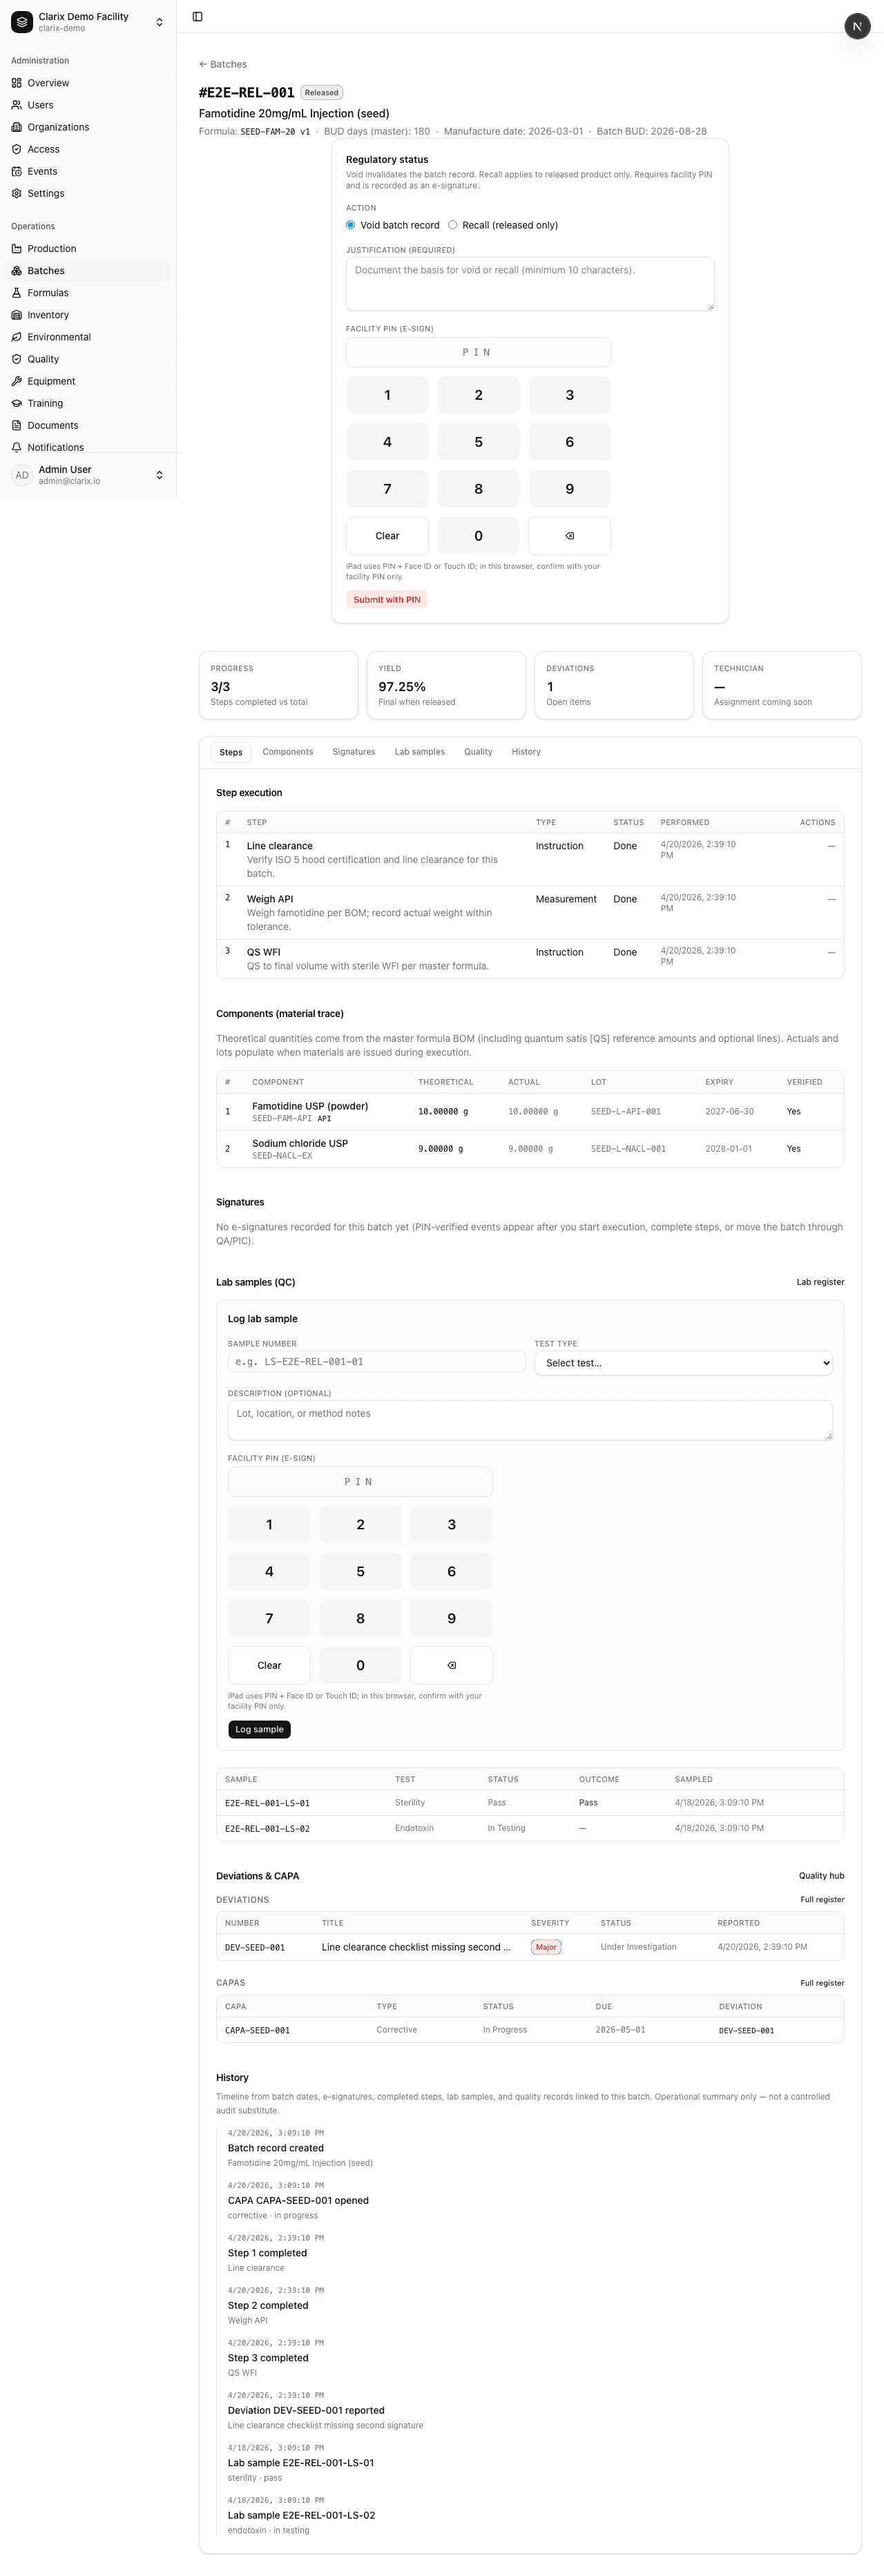
Figure 10. Released record.
5. Production board
What it does: Presents a scheduling / kanban-style view of active pipeline batches so production leadership can see what is running or queued and align technicians and rooms.
Limitations: Not a finite-capacity APS optimizer; it visualizes and links to batches rather than replacing detailed finite scheduling tools unless you extend usage. Integration with building automation or MES is not implied.
Figure 11: Production overview screen.
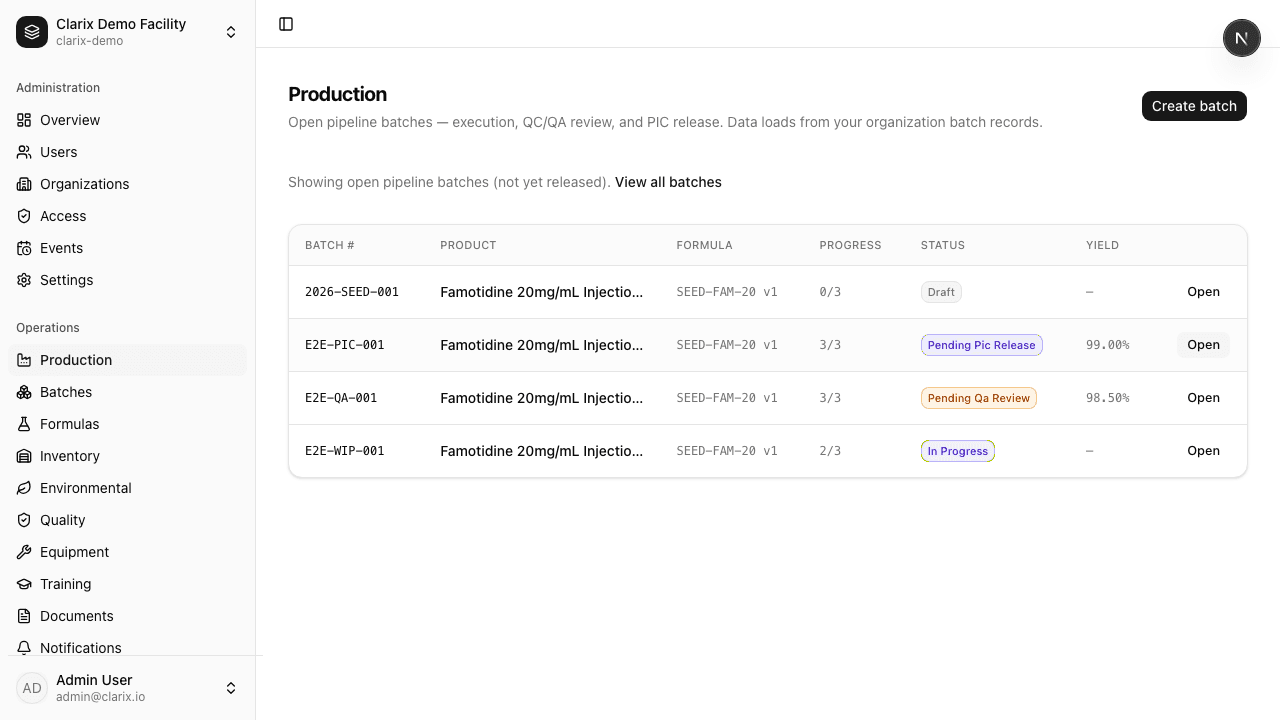
Figure 11. Production board.
6. Lab and QC samples
What it does: Registers lab samples, associates them with batches where applicable, and tracks test types and status so QC work is visible alongside the batch record.
Limitations: External lab portals, instrument file ingestion, and full LIMS-style stability programs are out of scope unless integrated separately. Result entry depth follows the screens implemented in your deployment.
Figures 12--13: Lab hub and sample register.
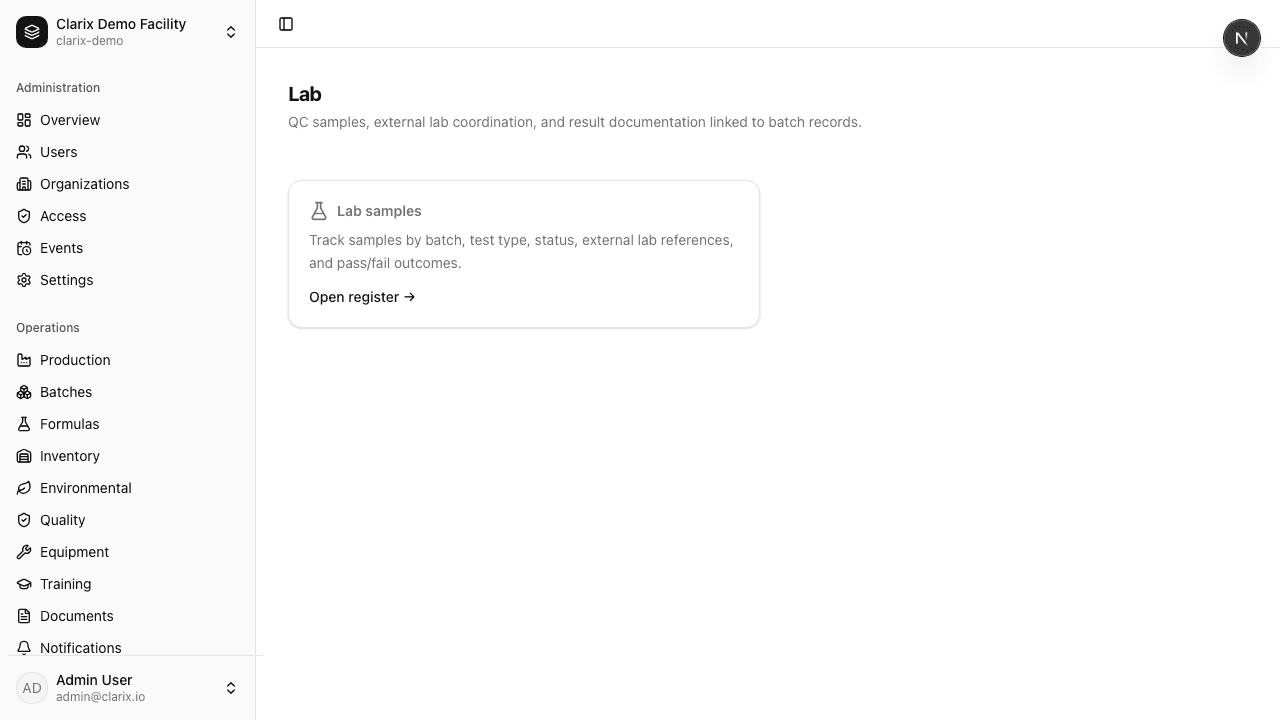
Figure 12. Lab hub.
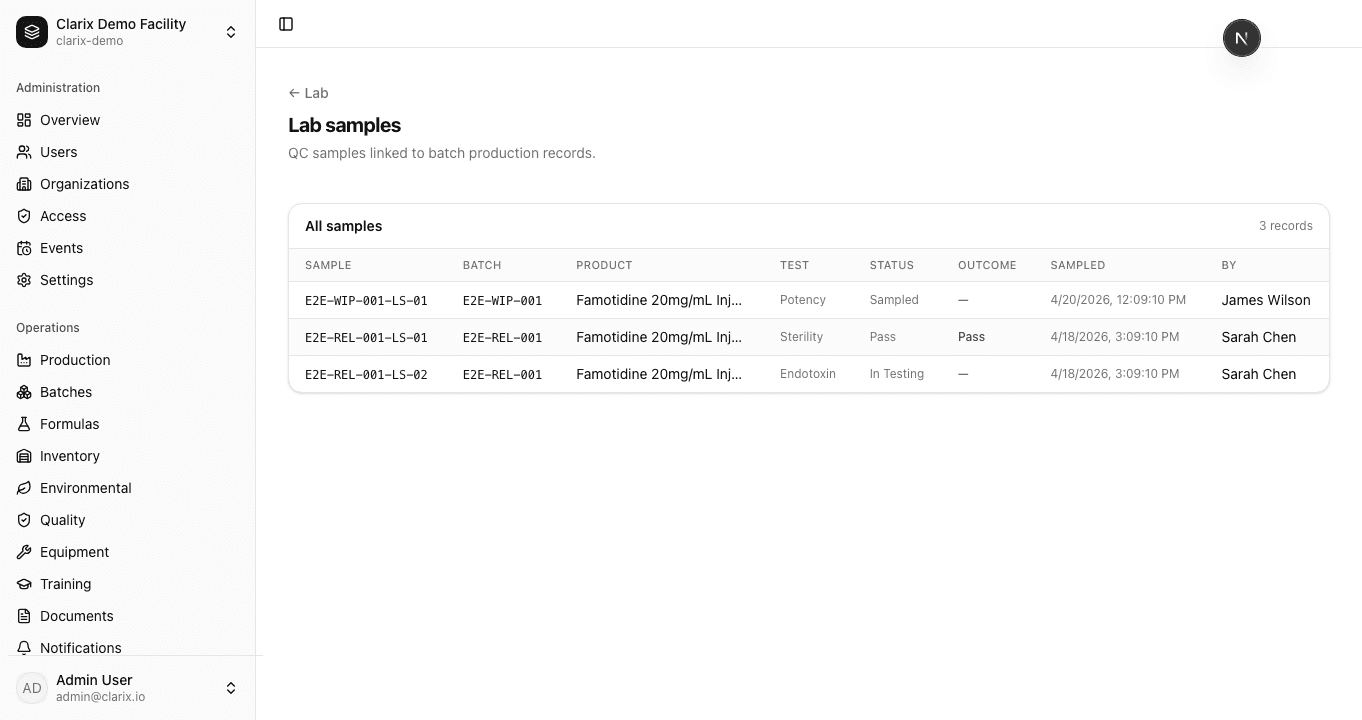
Figure 13. Sample register.
7. Quality --- deviations and CAPA
What it does: Captures deviation records and CAPA actions, with linkage concepts to batches and quality investigation workflows so issues are traceable to product and process.
Limitations: Maturity of escalation rules, automated trending, and regulatory report generation varies by configuration---this build demonstrates structure and lists, not a complete QMS replacement for complaint handling or PMS unless expanded.
Figures 14--16: Quality hub, deviation list, CAPA list.
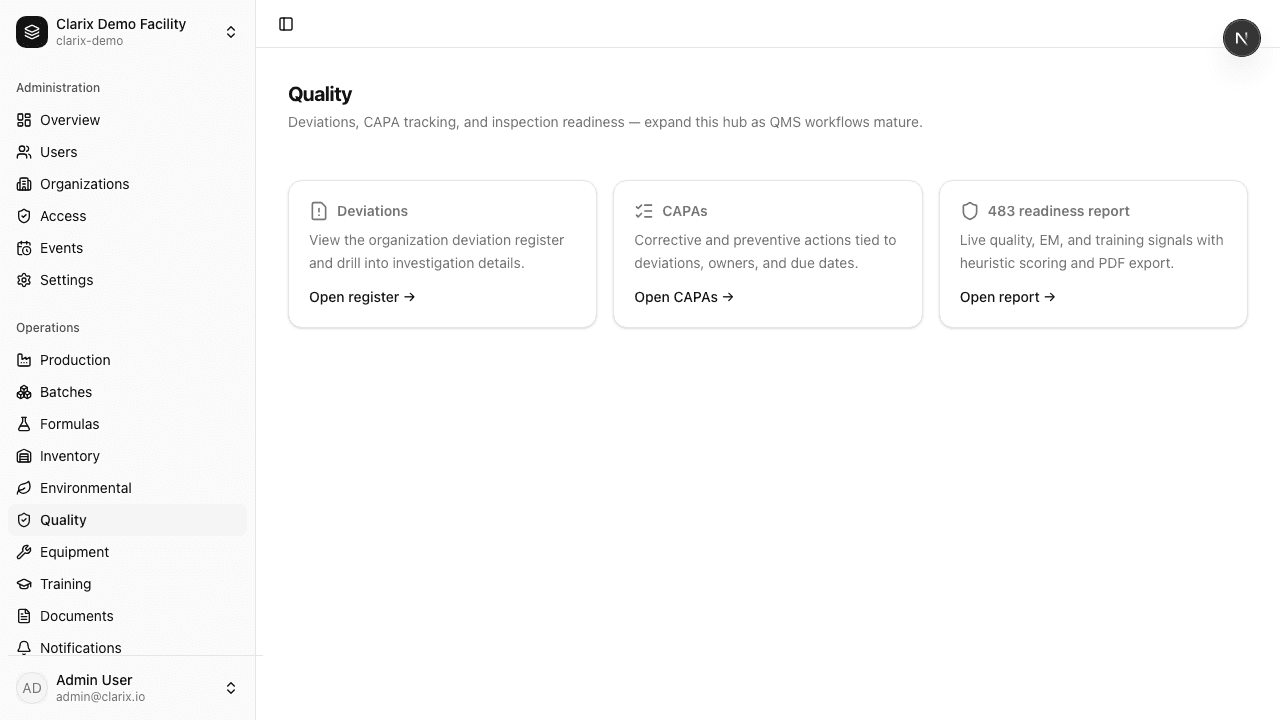
Figure 14. Quality hub.
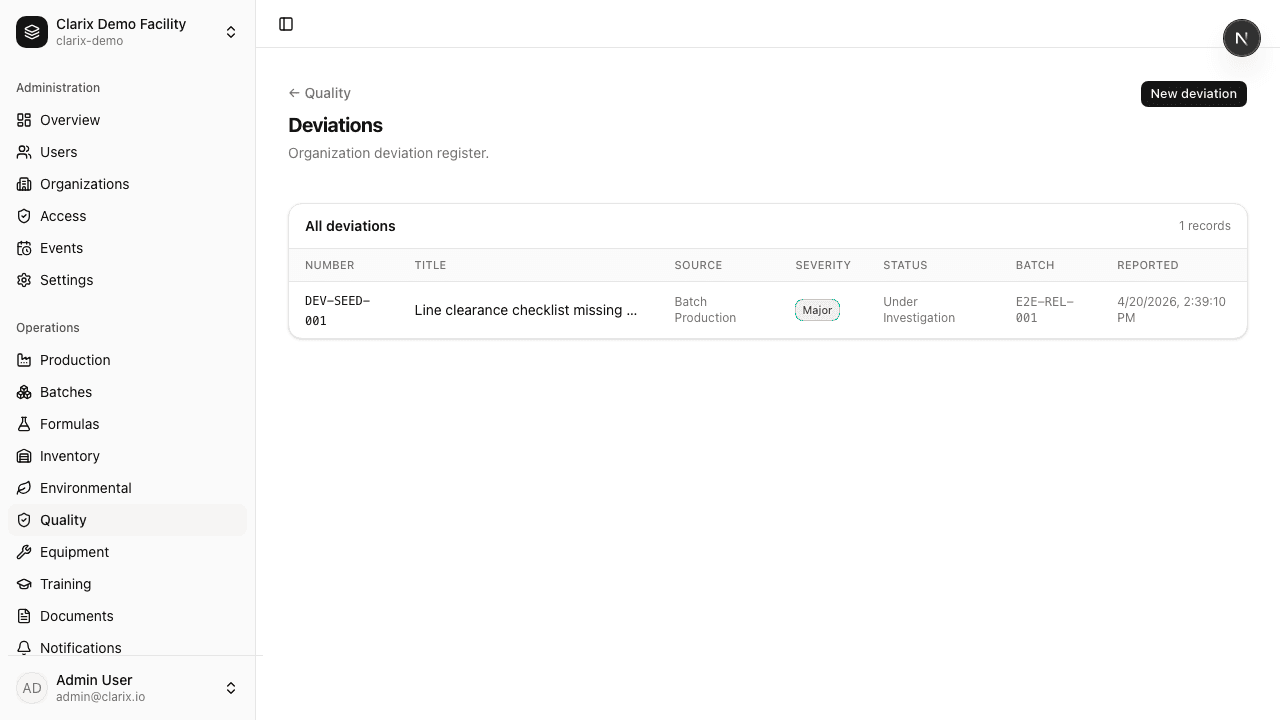
Figure 15. Deviations.
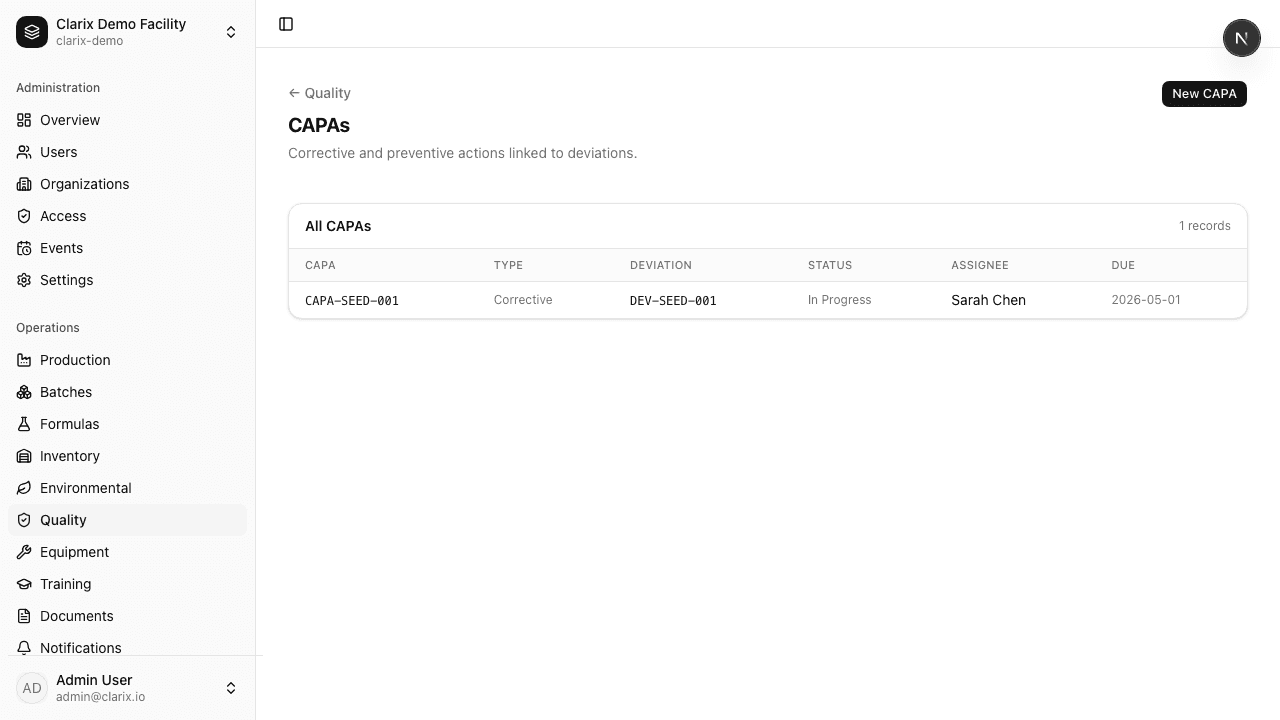
Figure 16. CAPAs.
8. Environmental monitoring
What it does: Supports monitoring concepts for rooms and facilities and tracks excursions (out-of-limits events) for QA follow-up and batch impact assessment when tied to procedures.
Limitations: Real-time sensor ingestion depends on integrations; the UI demonstrates structure and records---not a SCADA replacement. Sampling schedules may be simplified versus your full EM program.
Figures 17--18: Monitoring view and excursion list.
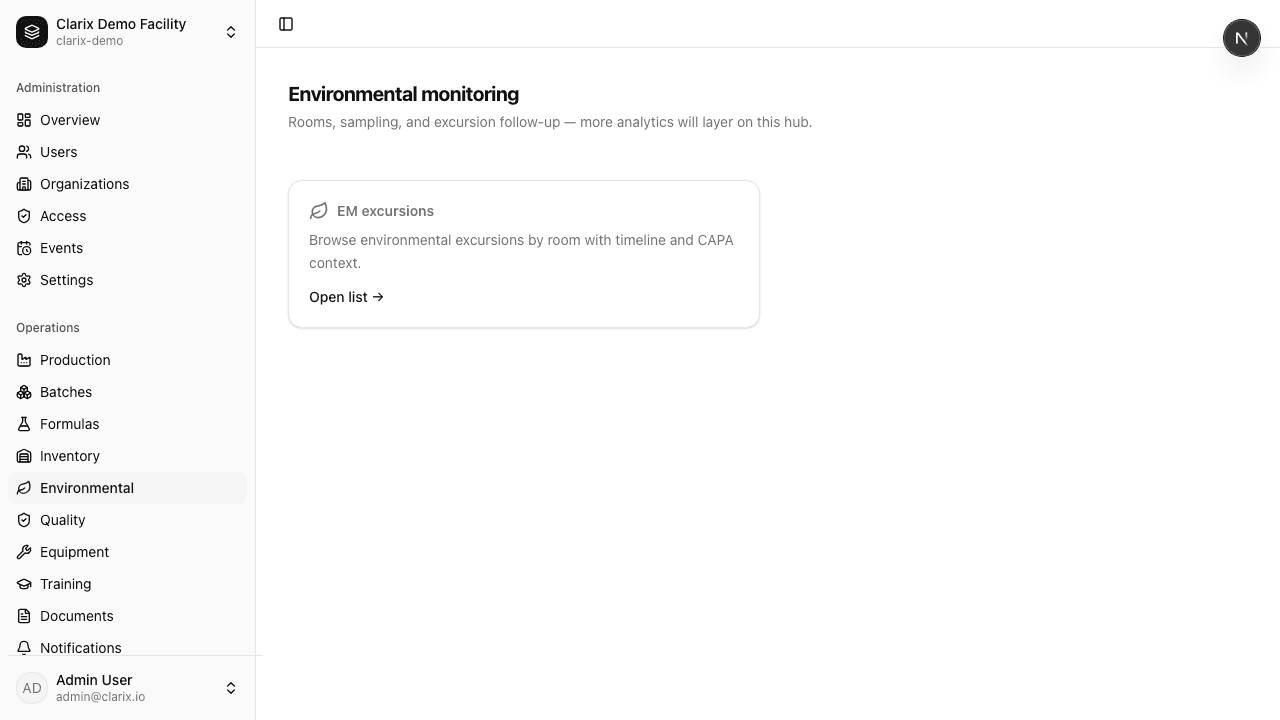
Figure 17. Environmental monitoring.
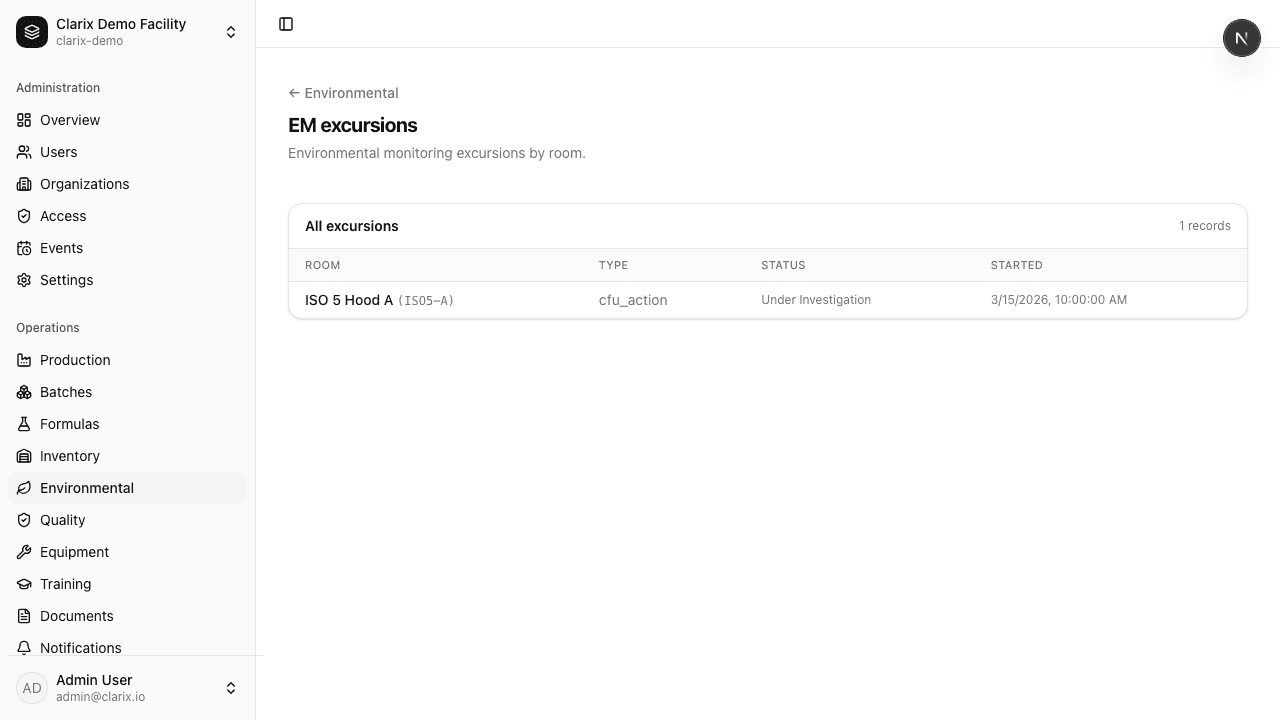
Figure 18. Excursions.
9. Equipment
What it does: Equipment registry and asset views to associate balances, fillers, hoods, etc., with qualification/calibration/cleaning concepts as modeled---so only equipment fit for use appears in the operational story.
Limitations: Full calibration metrology, maintenance CMMS integration, and 21 CFR Part 11 closure on third-party systems require explicit interfaces. Depth of cleaning logs per SOP cycle varies by implementation.
Figures 19--20: Registry and asset list.
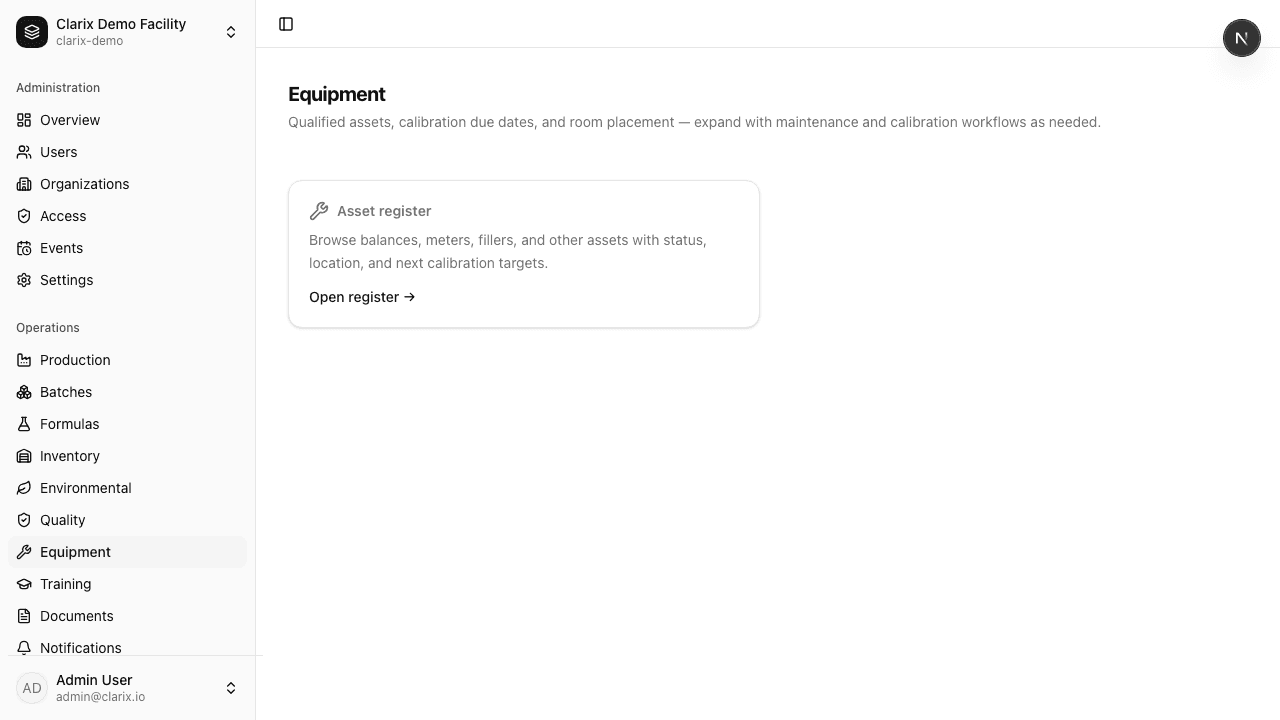
Figure 19. Equipment registry.
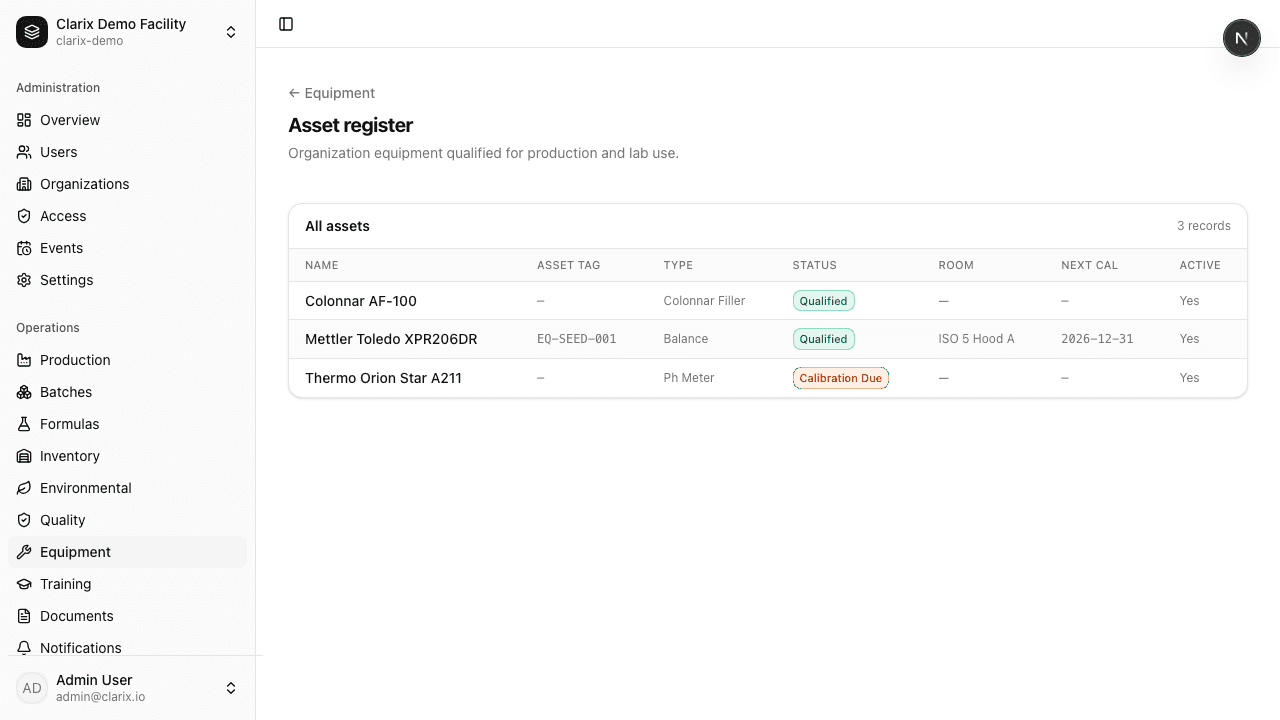
Figure 20. Equipment assets.
10. Training and controlled documents
What it does: Training hub and training records support personnel qualification tracking; document library holds metadata for controlled content (policies, SOPs, forms) aligned to operational and audit needs.
Limitations: Not a full learning management system (no SCORM delivery by default). Document control may not include your full periodic review and obsolete-watermark workflow until configured; file storage backend depends on deployment choices.
Figures 21--23: Training hub, records list, document library.
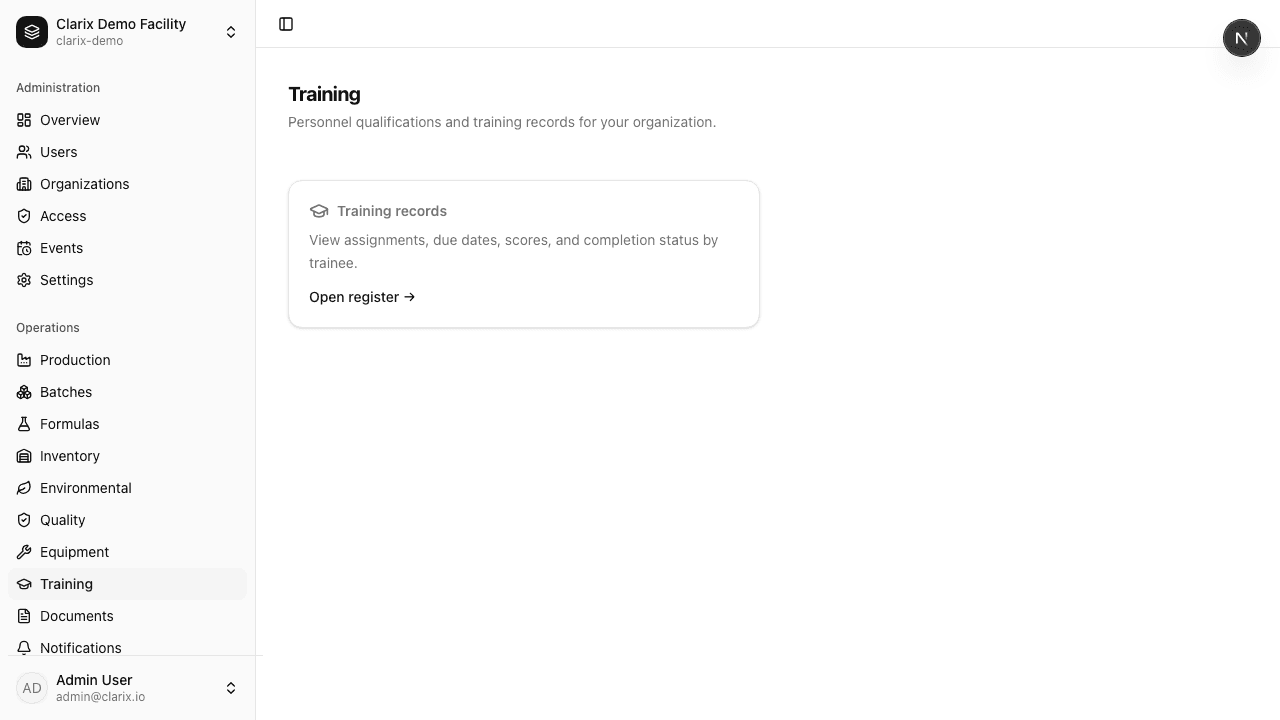
Figure 21. Training hub.
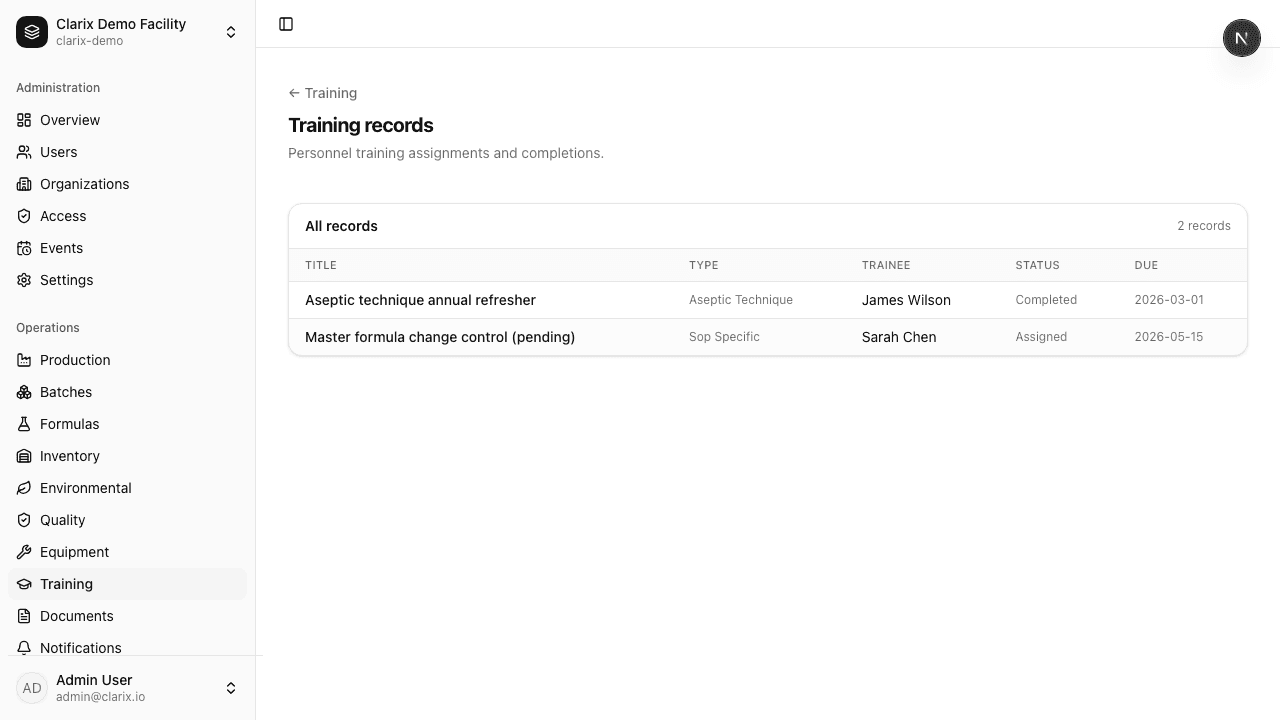
Figure 22. Training records.
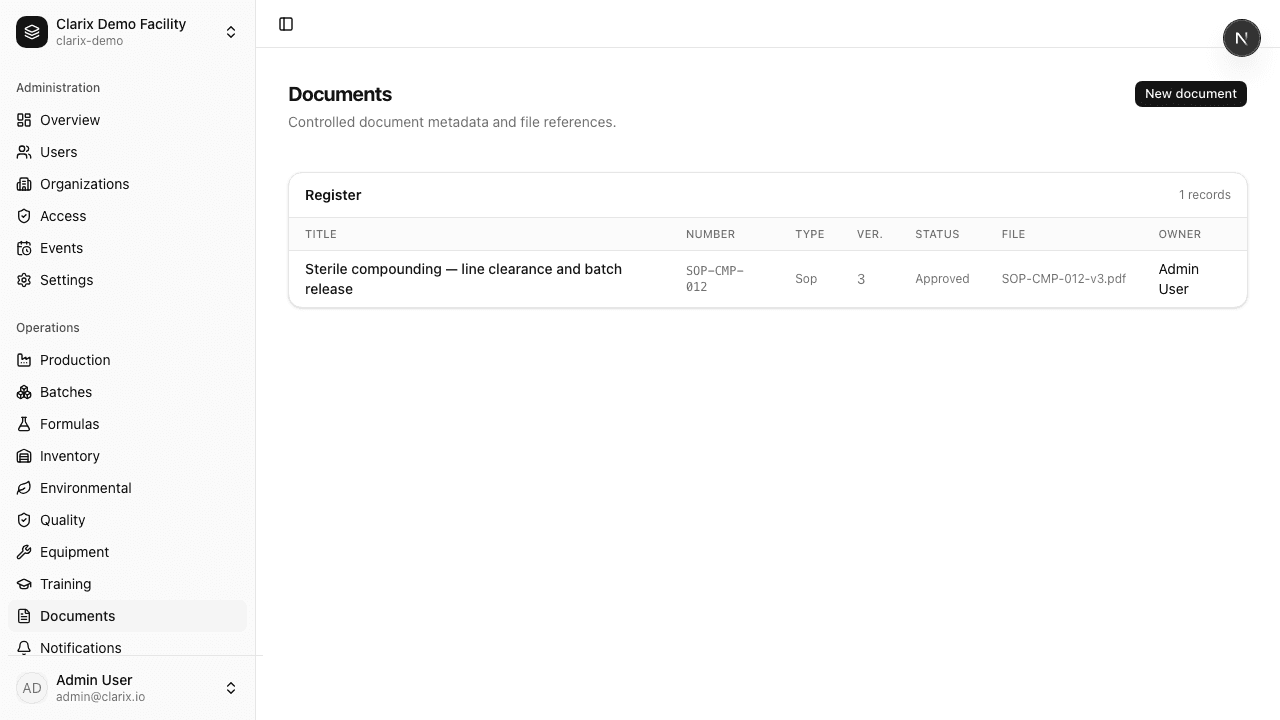
Figure 23. Document library.
11. Notifications
What it does: In-app notification center to route users to batches, quality items, or system events needing attention---reducing reliance on informal email for handoffs.
Limitations: Delivery channels (SMS, pager, Teams) depend on integration; default is in-app. Volume and retention policies are configurable but not shown here.
Figure 24: Notification center.
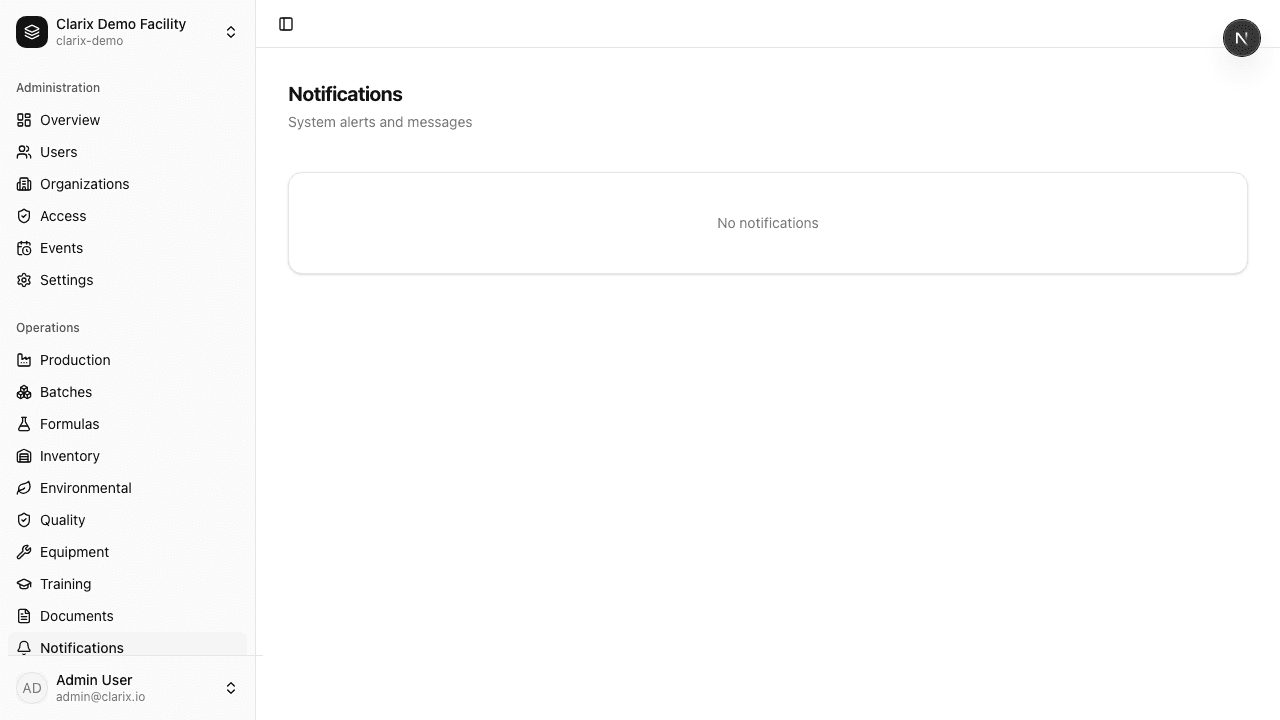
Figure 24. Notifications.
12. Reports and analytics
What it does: Summarizes batch throughput, quality-oriented metrics, and inspection-readiness style views so management can prioritize remediation and capacity.
Limitations: Reporting is operational analytics---not statutory filing output without your validation of definitions. Custom regulatory report packs may require additional work. Data reflects Clarix records only.
Figures 25--28: Reports hub, batch analytics, quality metrics, readiness-oriented view.
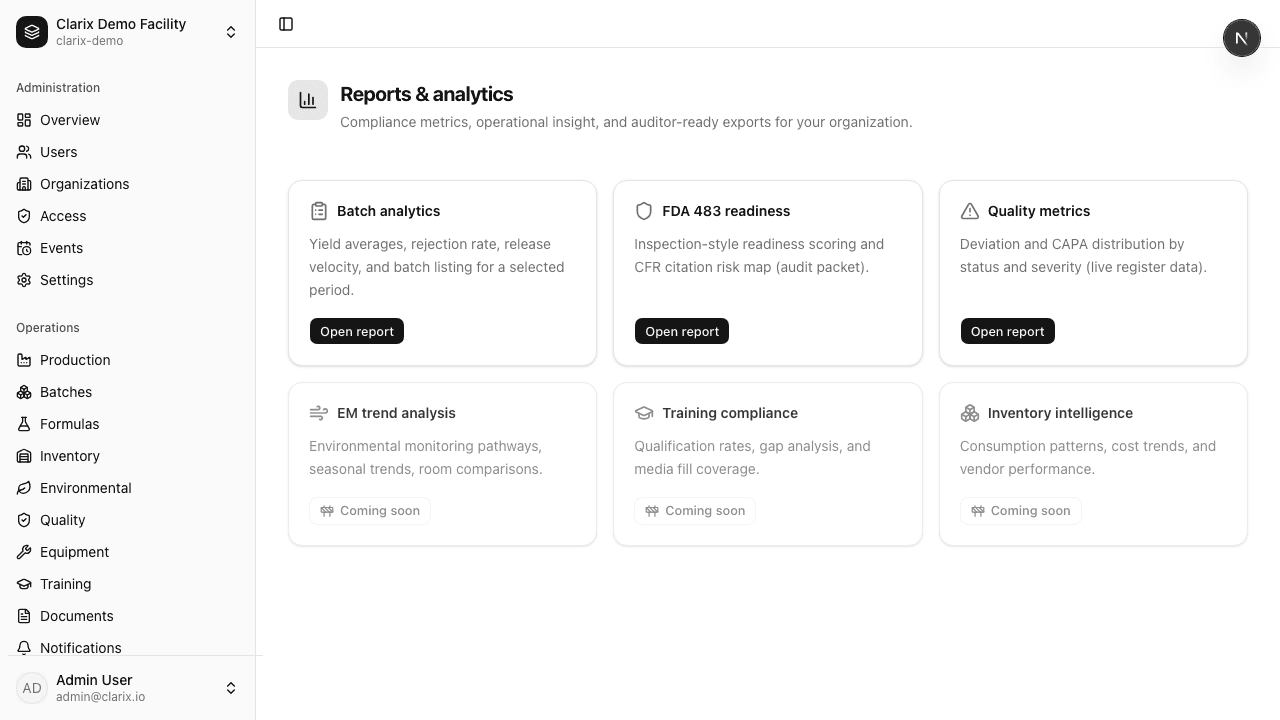
Figure 25. Reports hub.
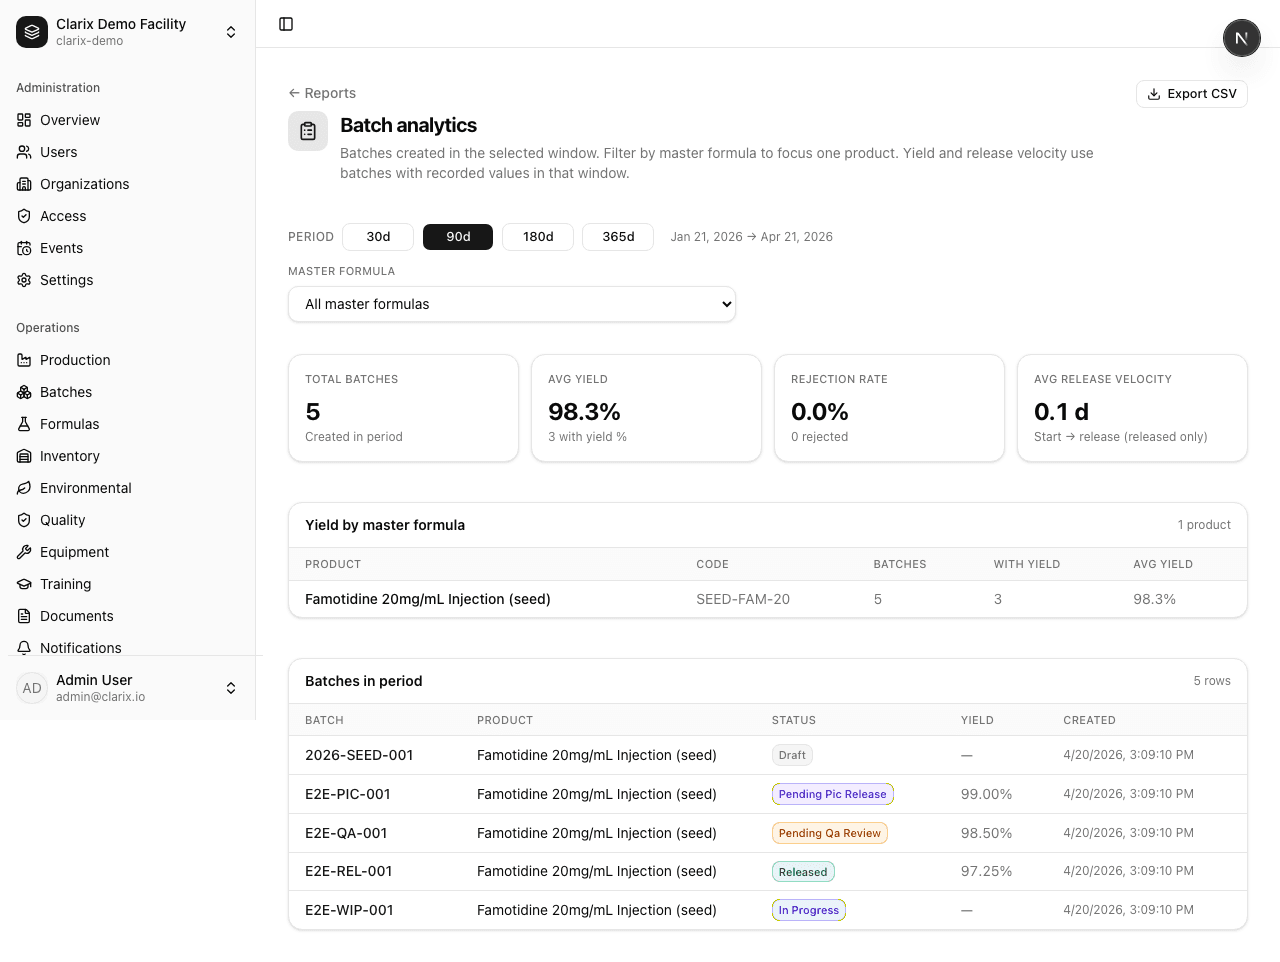
Figure 26. Batch analytics.
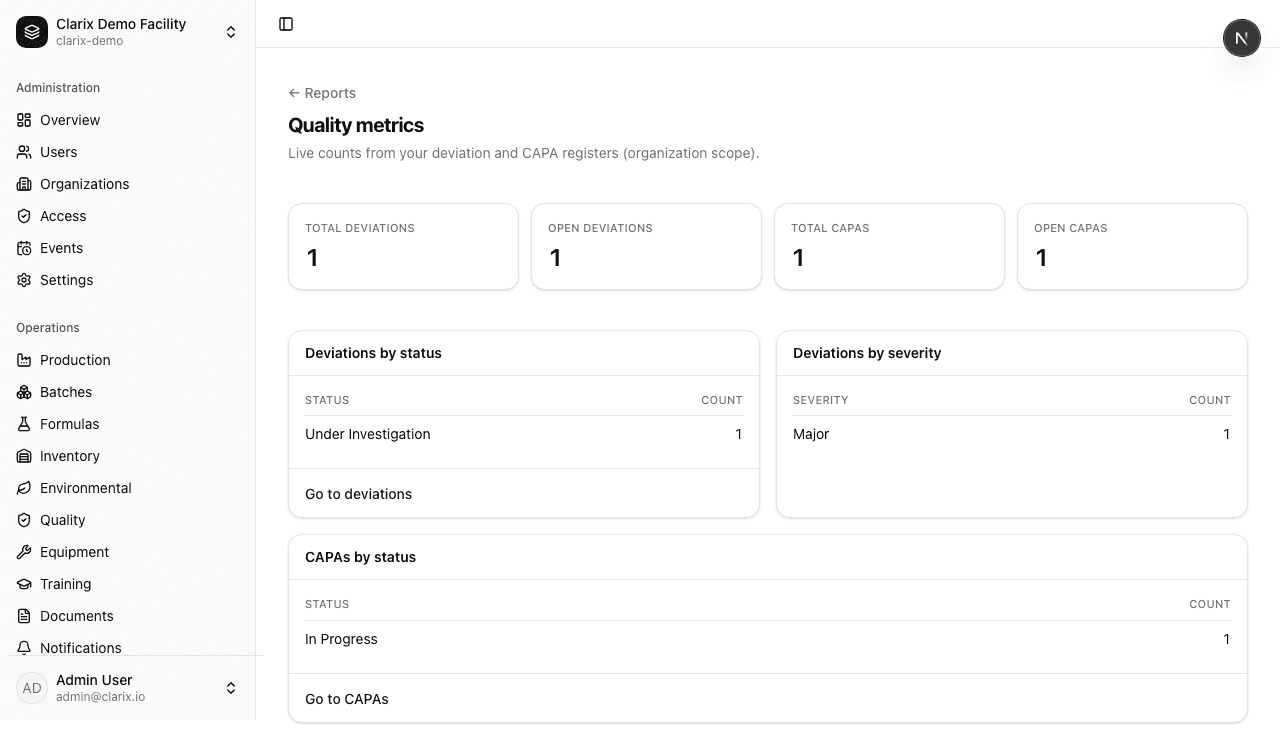
Figure 27. Quality metrics.
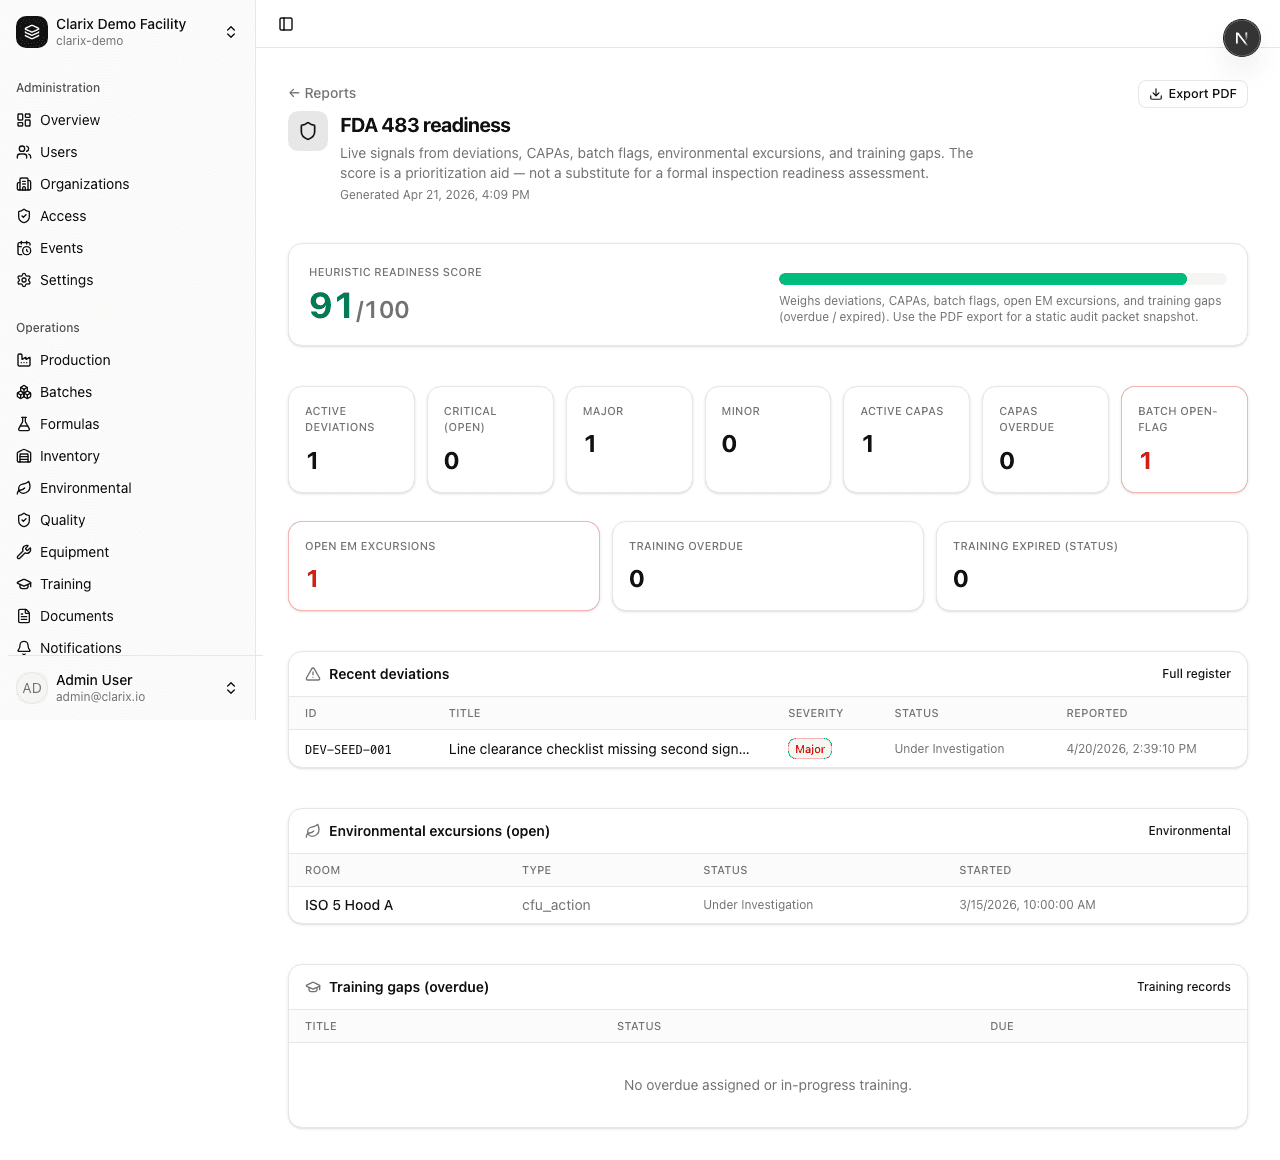
Figure 28. Inspection readiness style report.
13. User settings
What it does: User preferences (for example appearance) and facility PIN used for electronic signatures on web workflows when the record calls for sign-off.
Limitations: Biometric or card readers are device-specific; PIN policy (length, rotation) is governed by your SOPs and validation, not fixed by these screens alone.
Figure 29: Settings including PIN.
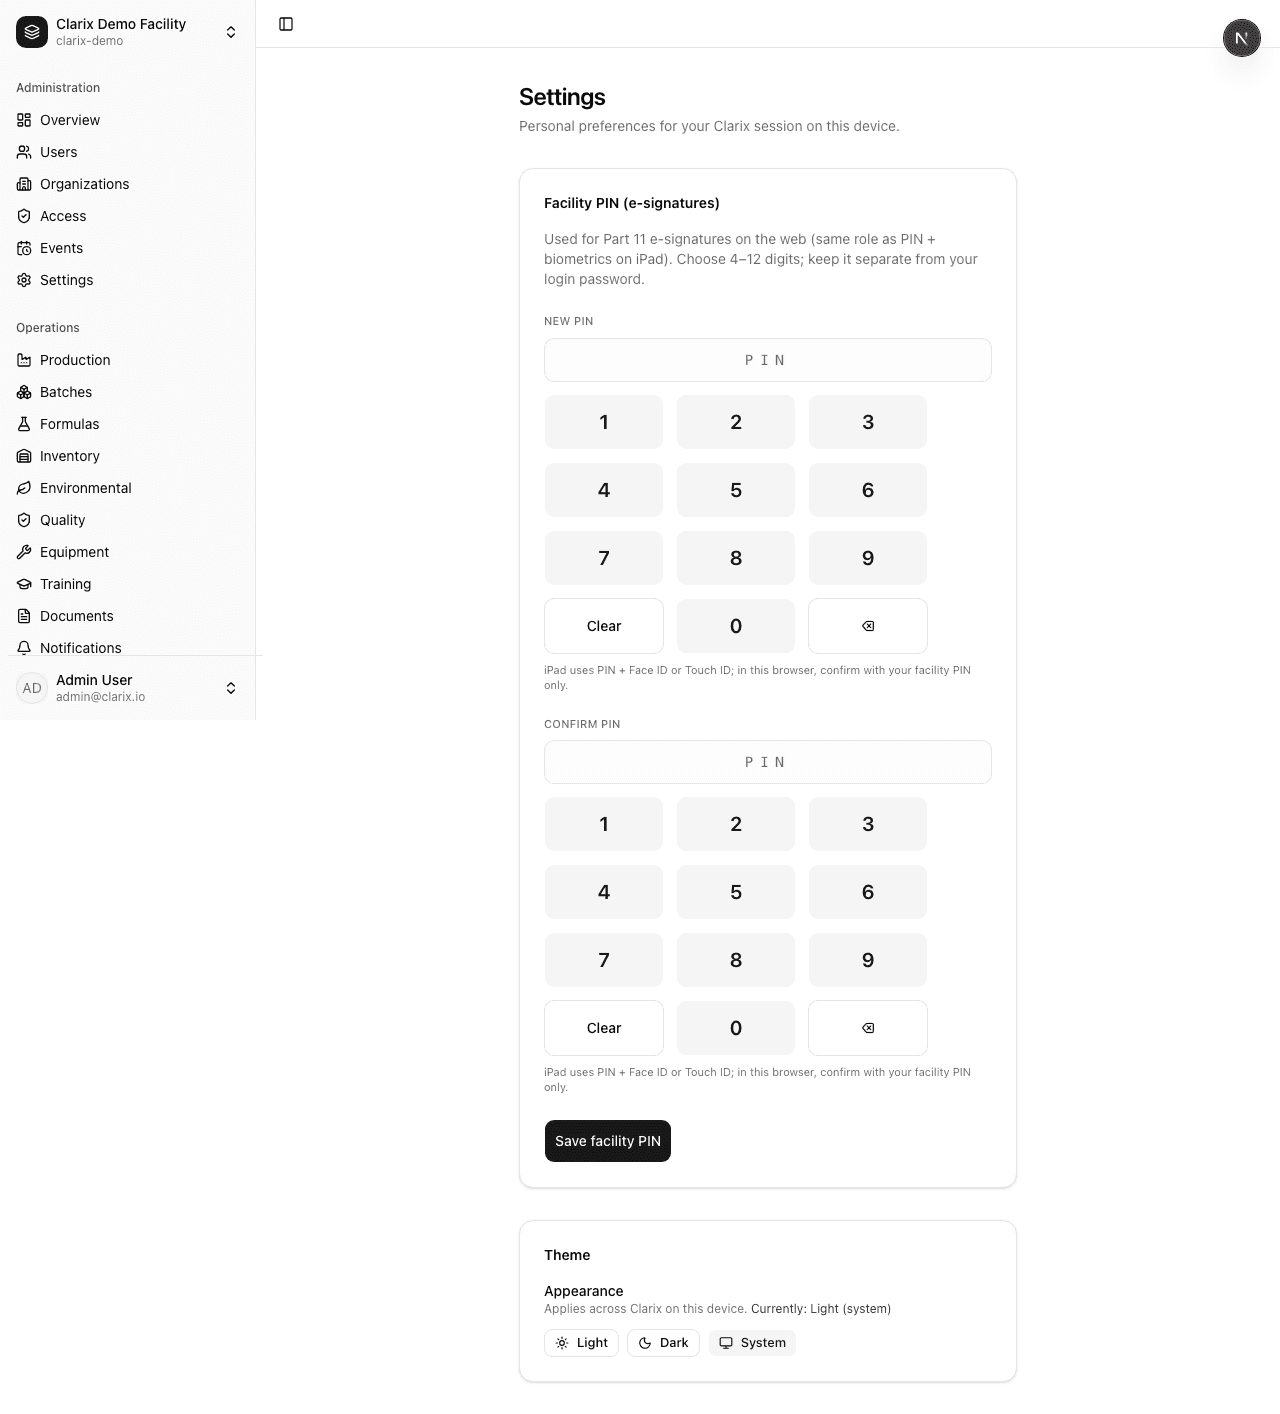
Figure 29. User settings.
14. Administration
What it does: Tenant-level administration: user directory, organizations, fine access control, auditable system events, and admin configuration---so IT and quality can align the system to governance.
Limitations: Enterprise SSO, automated HR provisioning, and cross-tenant reporting require explicit enterprise features and integration projects. Admin actions should be change-controlled per your policies.
Figures 30--34: Users, organizations, access, events, admin settings.
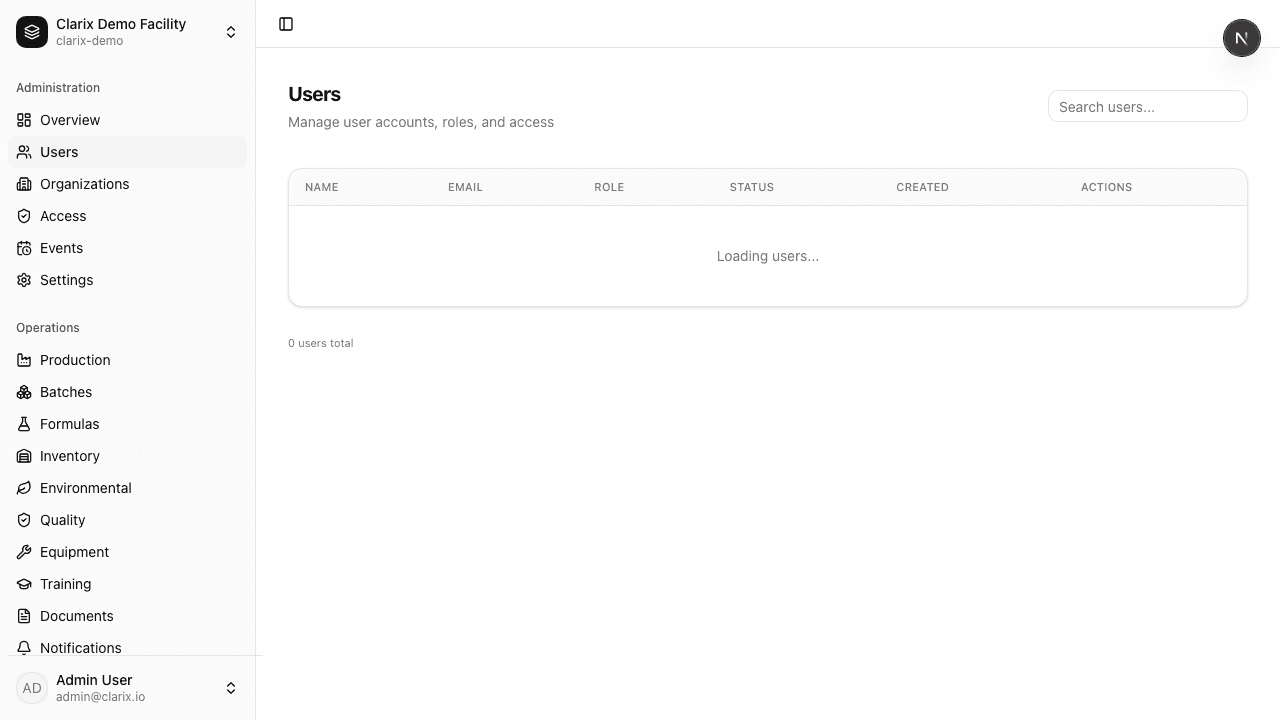
Figure 30. Admin: users.
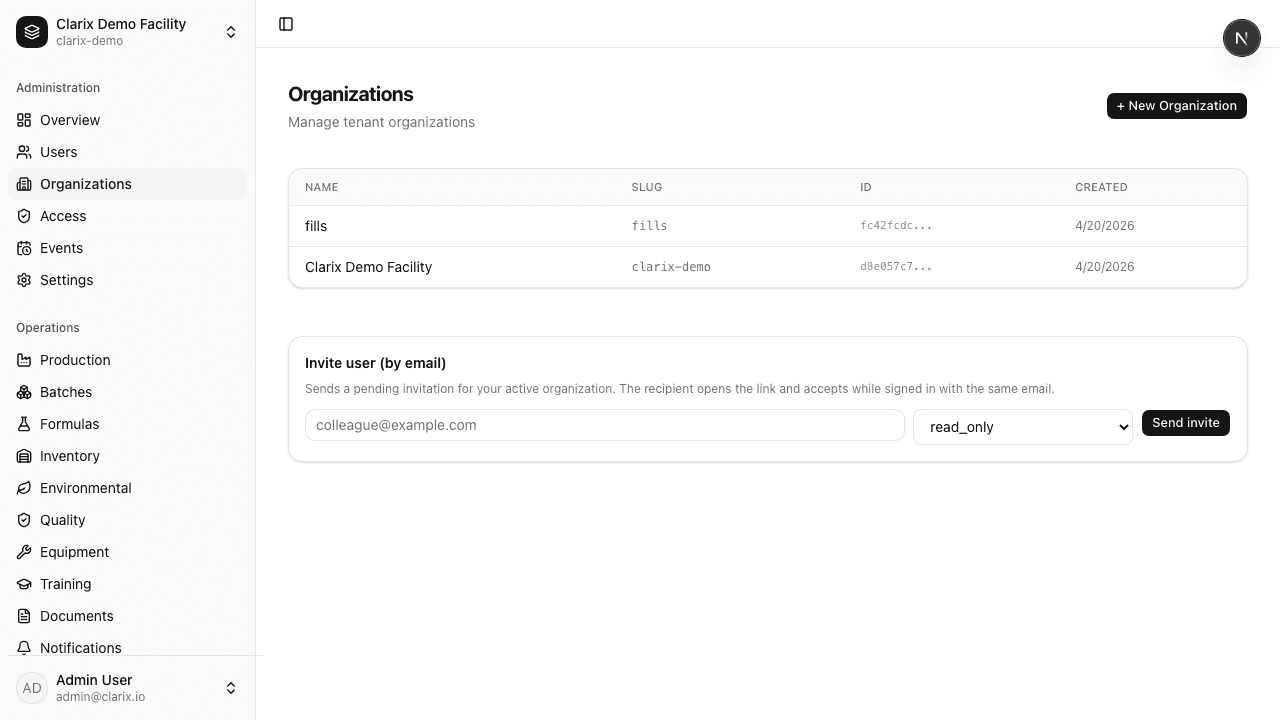
Figure 31. Admin: organizations.
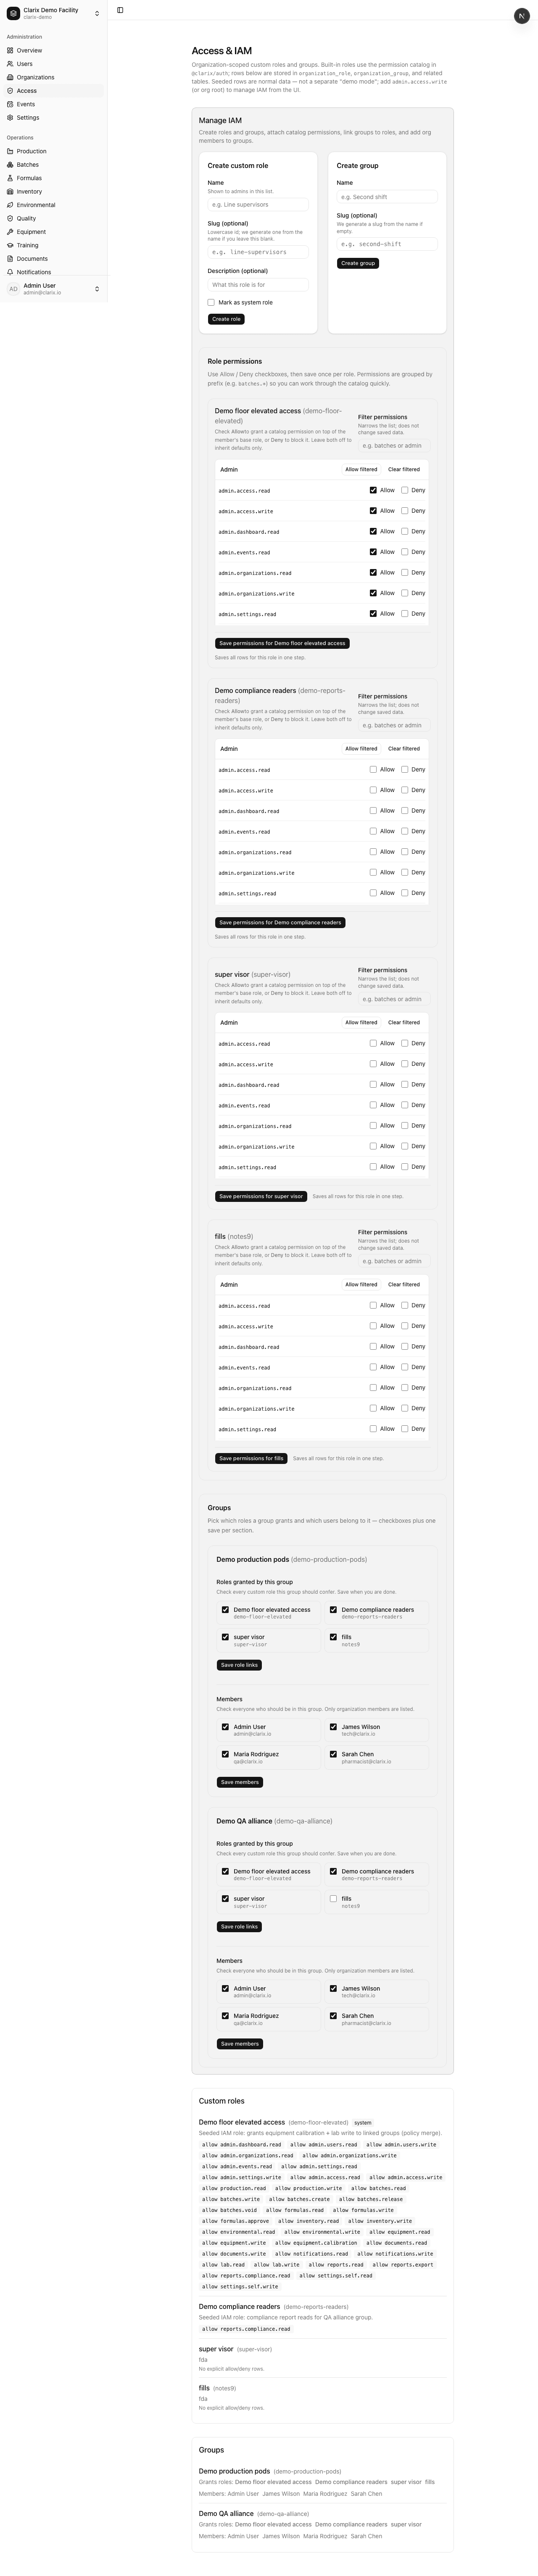
Figure 32. Admin: access.
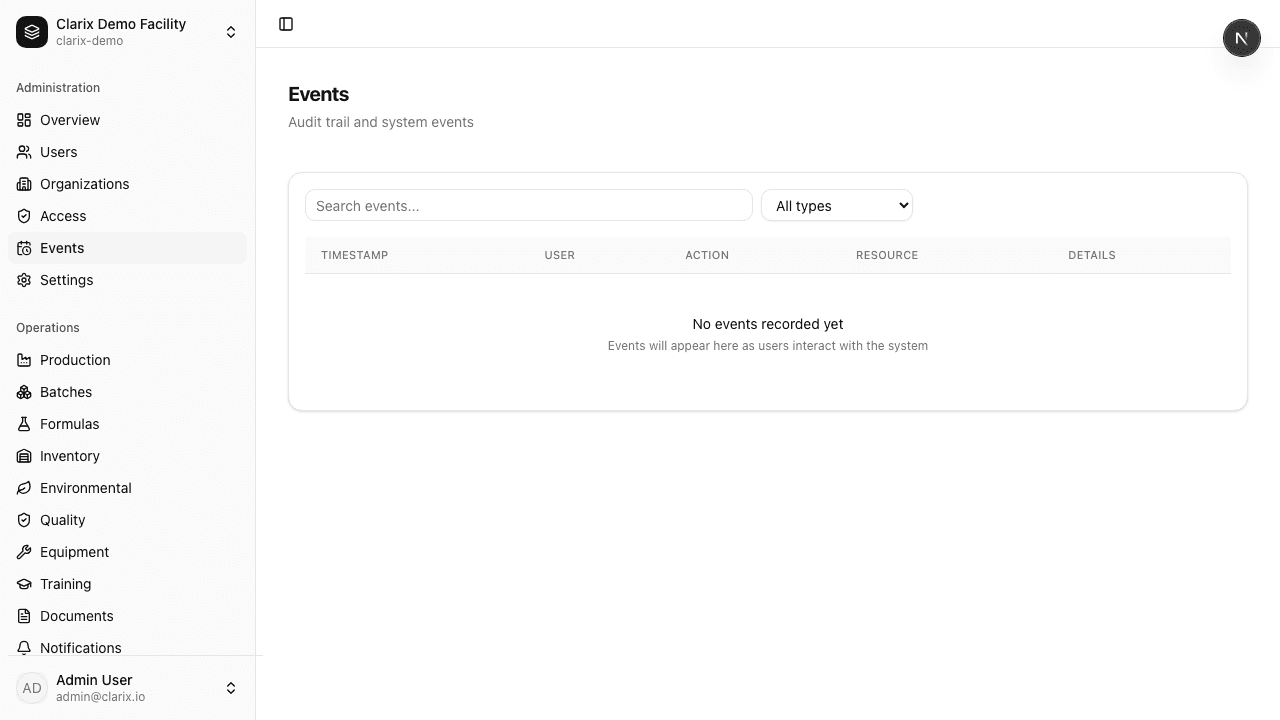
Figure 33. Admin: system events.
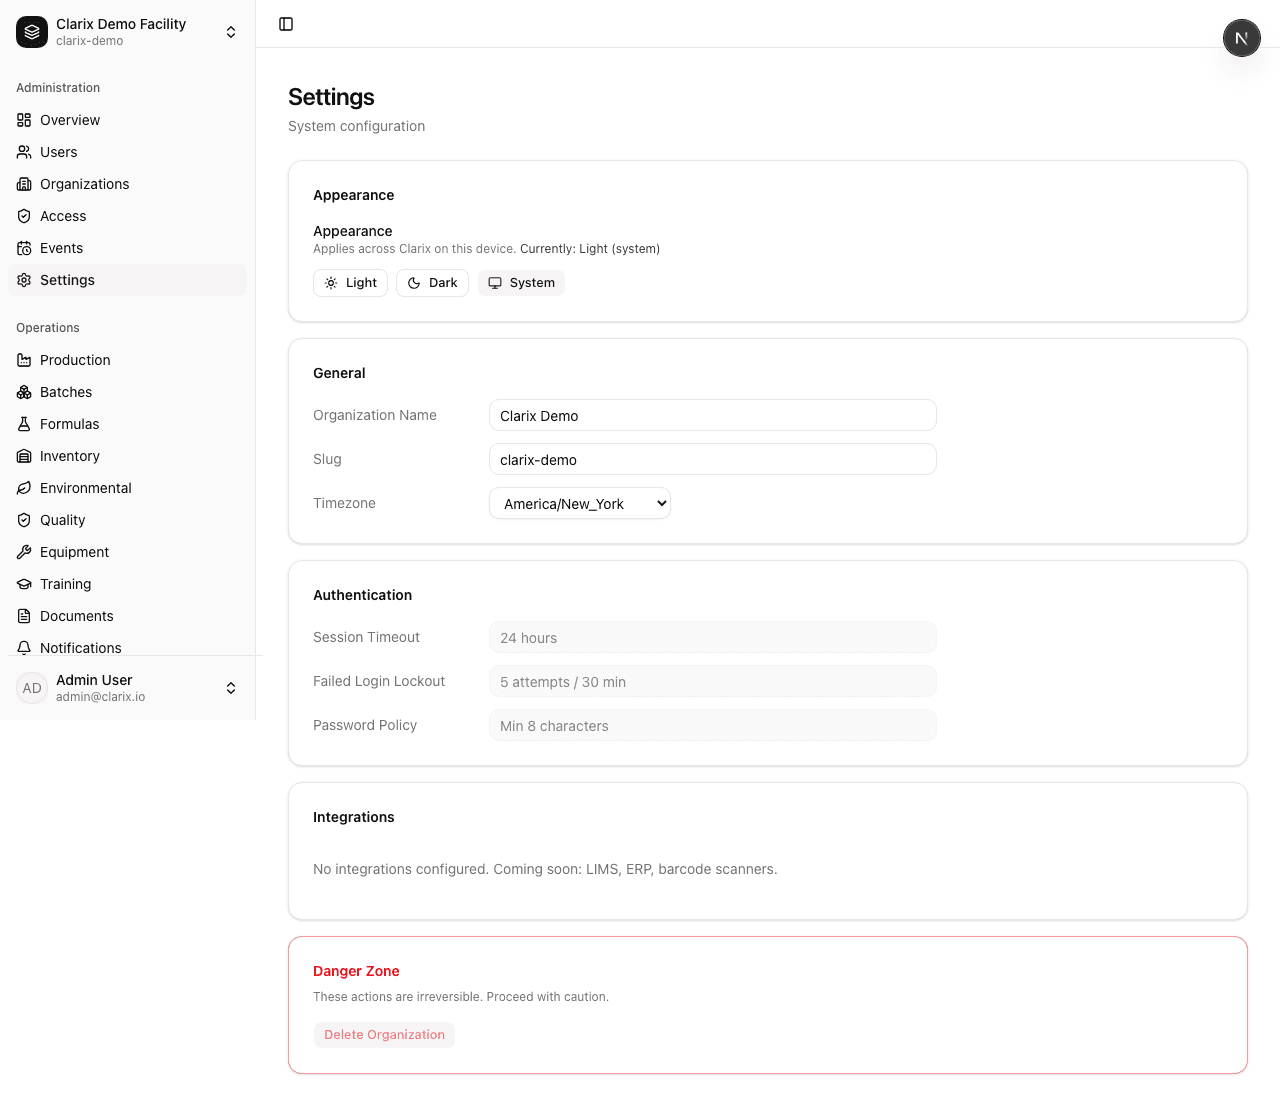
Figure 34. Admin settings.
15. Same batch lifecycle, different responsibilities
What it does: Role-based access hides or shows actions (for example starting steps vs approving QA vs PIC release). The product enforces allowed transitions; ProRx's job descriptions and SOPs remain the authority on who holds which hat.
Limitations: Demo accounts illustrate patterns---your production role matrix may include additional titles (QA manager, production manager, warehouse clerk) with different permission bundles once configured.
Figures 35--37: Technician on a work-in-progress batch, QA on a QA-pending batch, PIC on a batch awaiting PIC release.
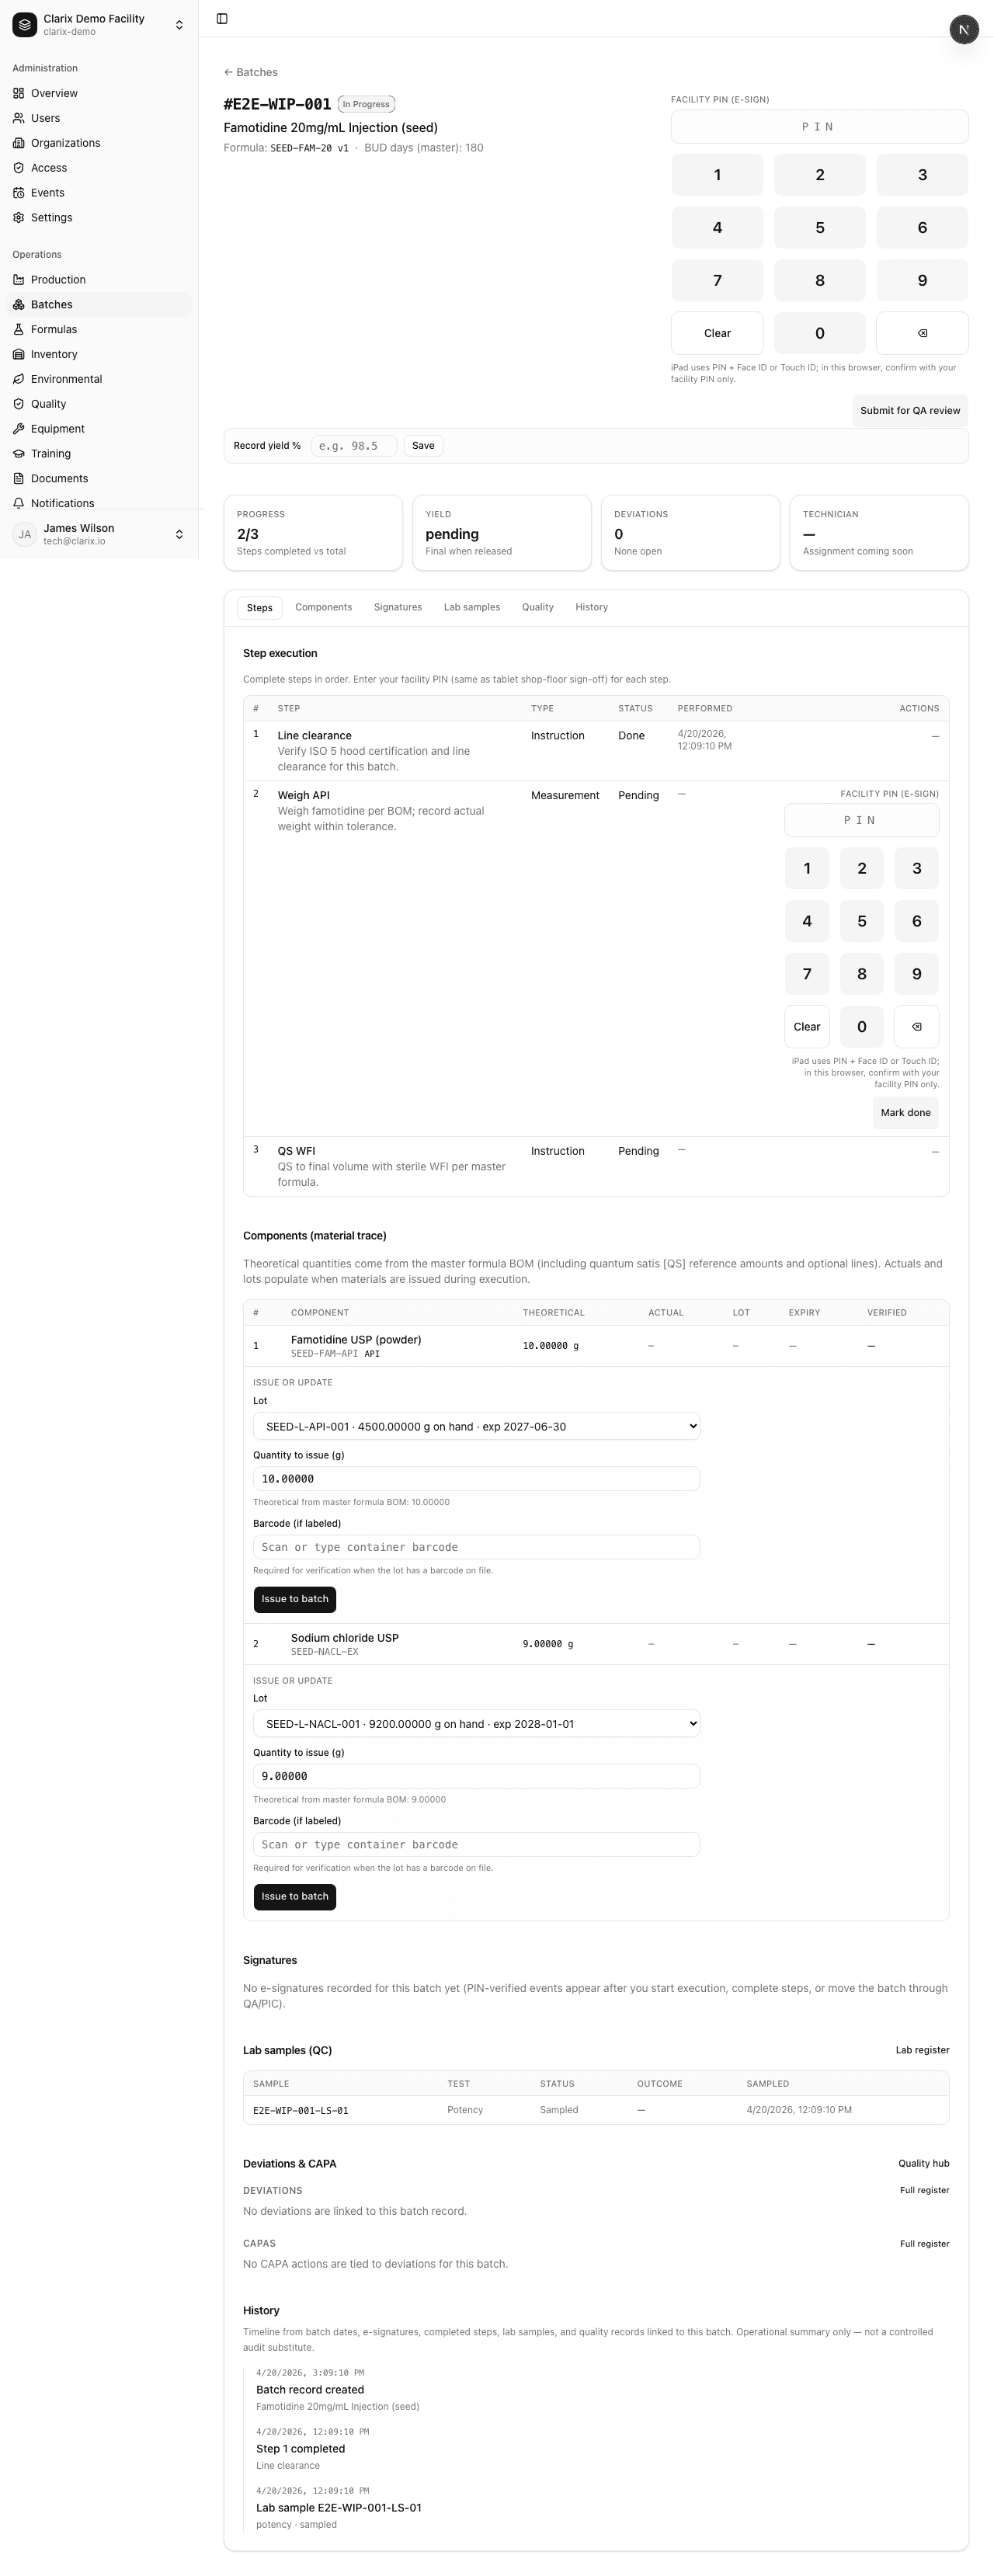
Figure 35. Compounding technician view.
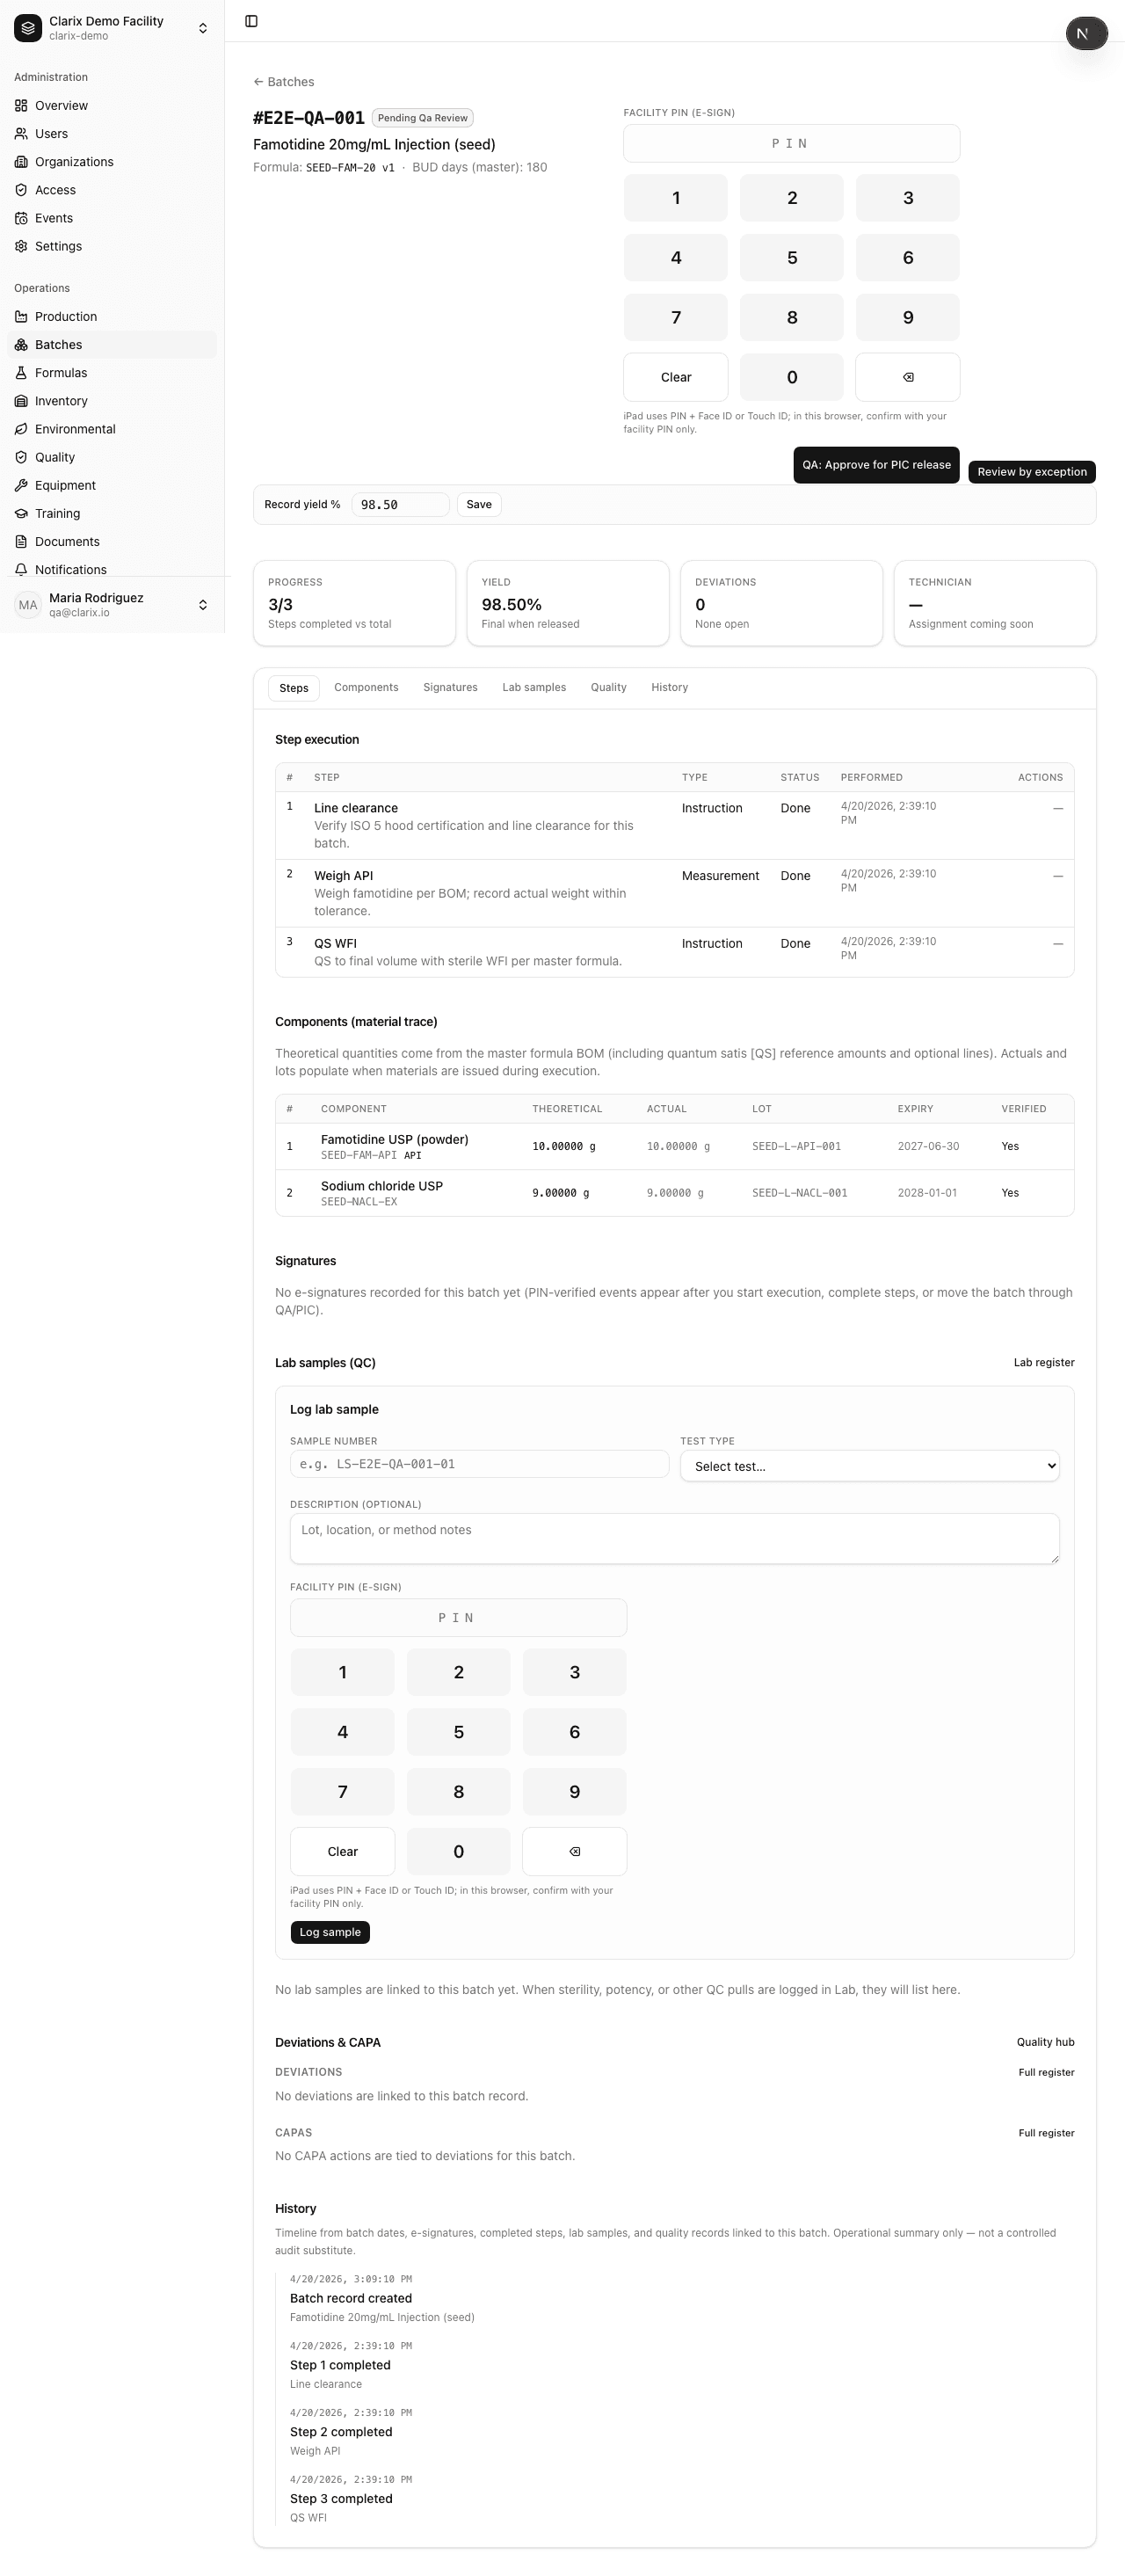
Figure 36. QA specialist view.
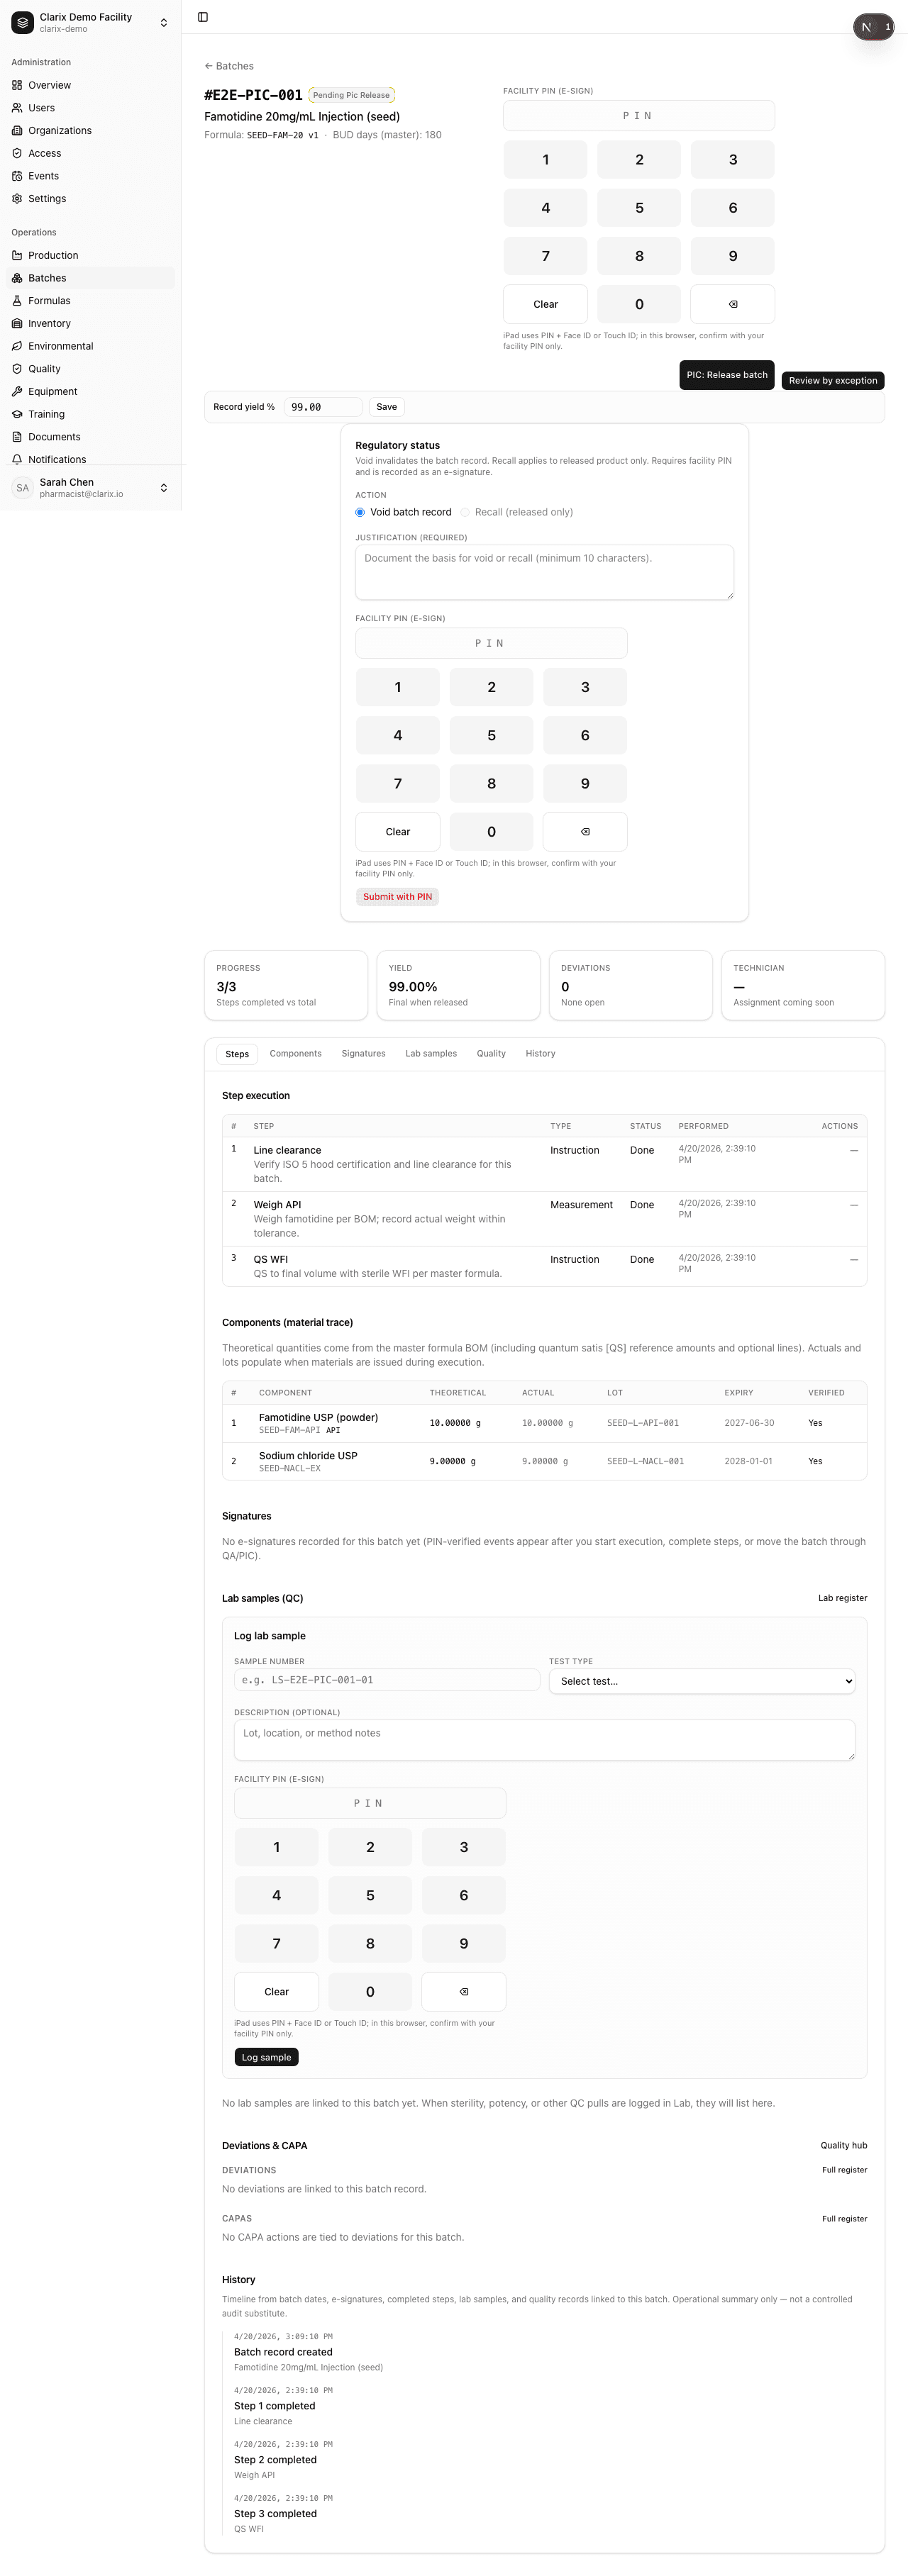
Figure 37. PIC view.
16. Creating new formulas and batches
What it does: Starts a new master formula draft (BOM and steps to be completed and approved) and creates a new batch by selecting an approved formula and assigning a unique batch number---entry points for new SKUs and new production runs.
Limitations: Regulatory appropriateness of draft content, change control, and training before first GMP use remain ProRx procedural obligations. The forms enforce required fields as coded---not every company-specific validation rule may be present on day one.
Figures 38--39: New formula screen and new batch screen.
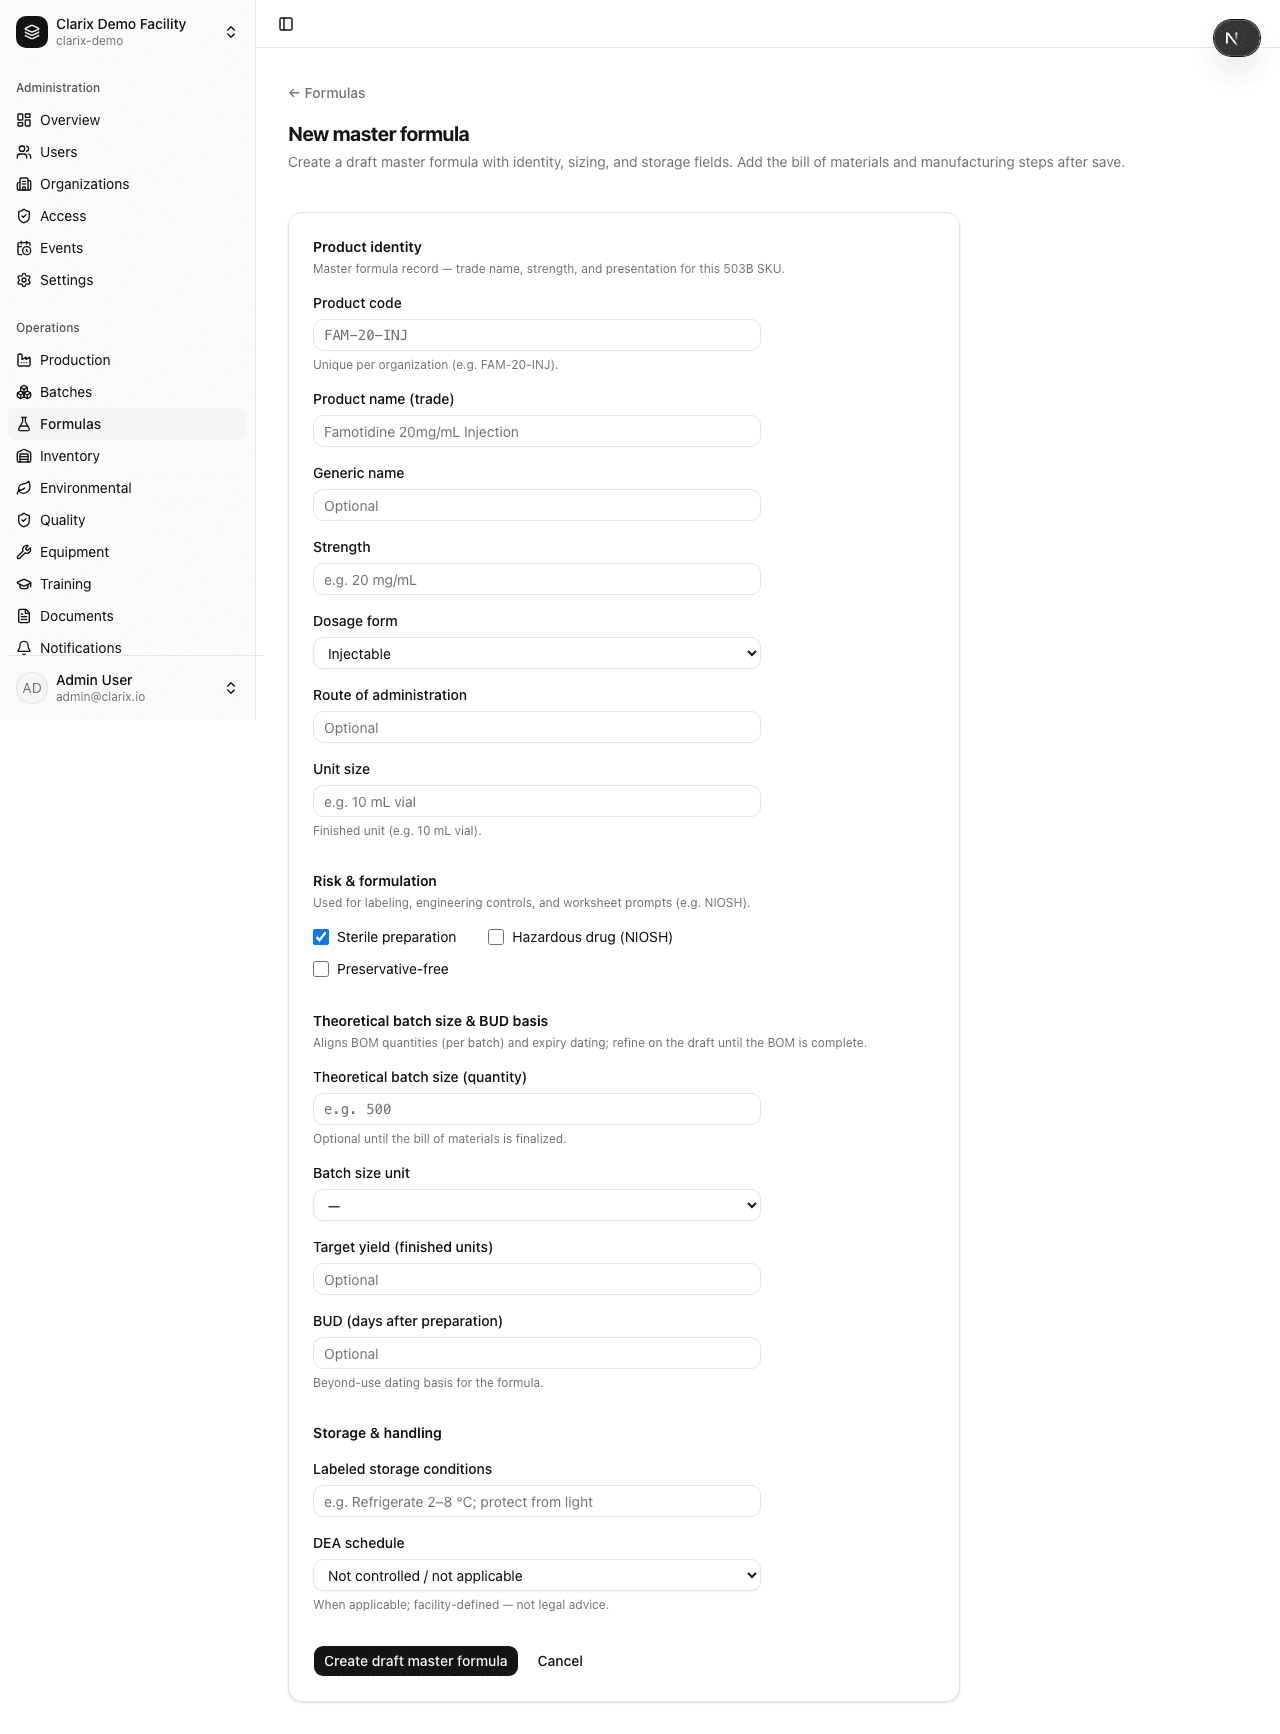
Figure 38. New master formula.
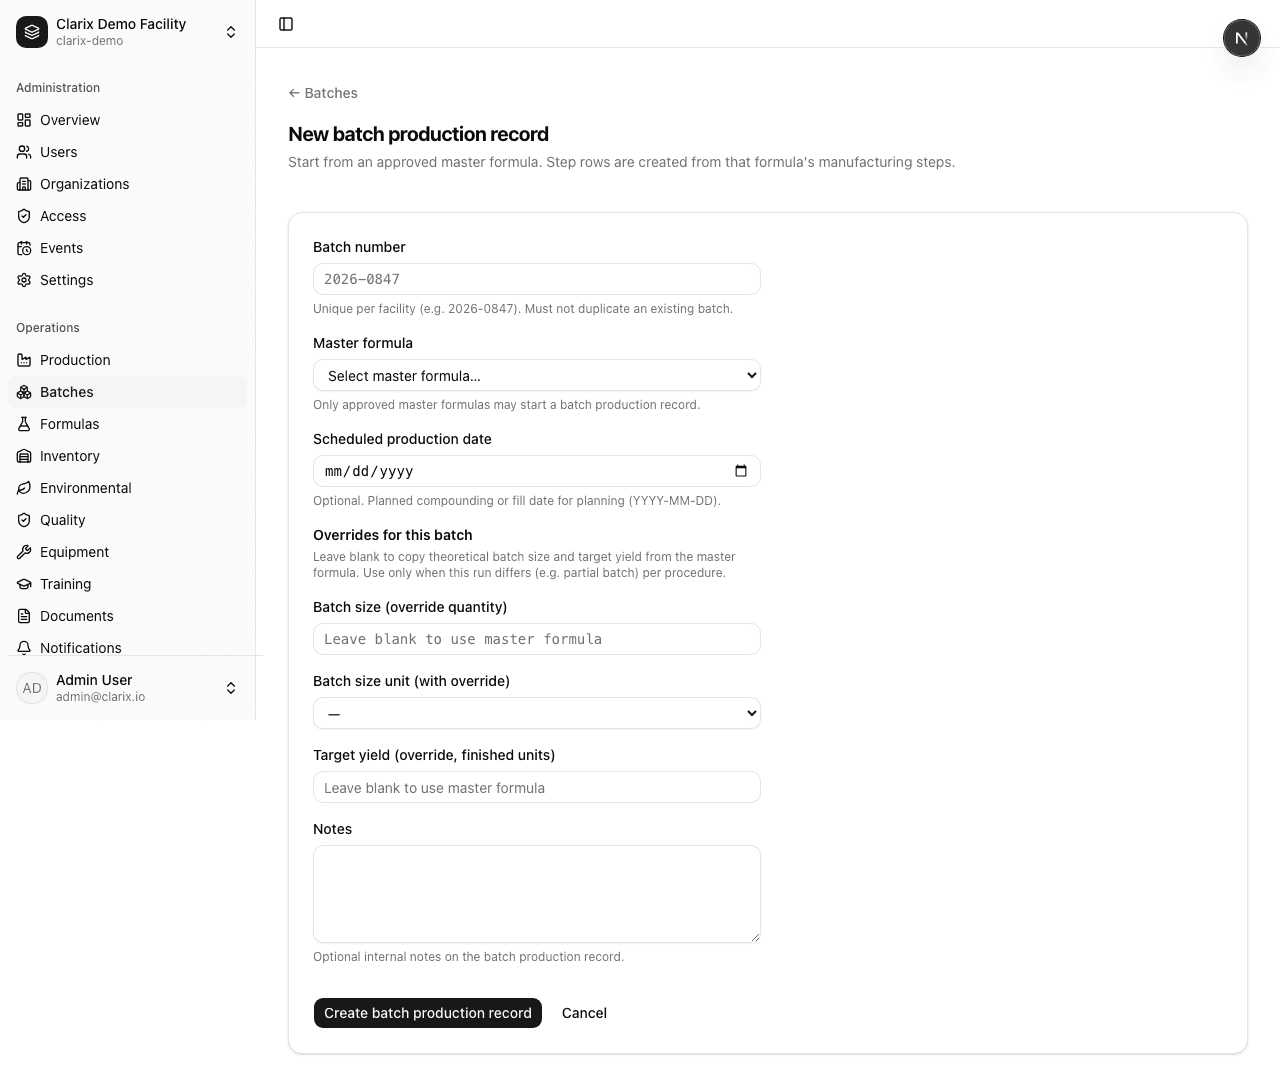
Figure 39. Create batch.
Closing summary
For ProRx Pharma, the value story is continuous: inventory truth feeds approved formulas, which drive controlled batch execution with lot traceability, QA and PIC sign-off, and supporting evidence in lab, environment, equipment, training, and documents---with analytics and admin to operate and govern the system. The screenshots are a guided tour of that capability in a demo tenant; your deployment will load ProRx-specific masters, batches, and validation evidence on top of the same flows.
Clarix · ProRx Pharma user story · Figures 1--39 · Demo environment