
Batch Analytics
Understand batch volume, average yield, rejection rates, and release velocity over time using the Batch Analytics report in Clarix.
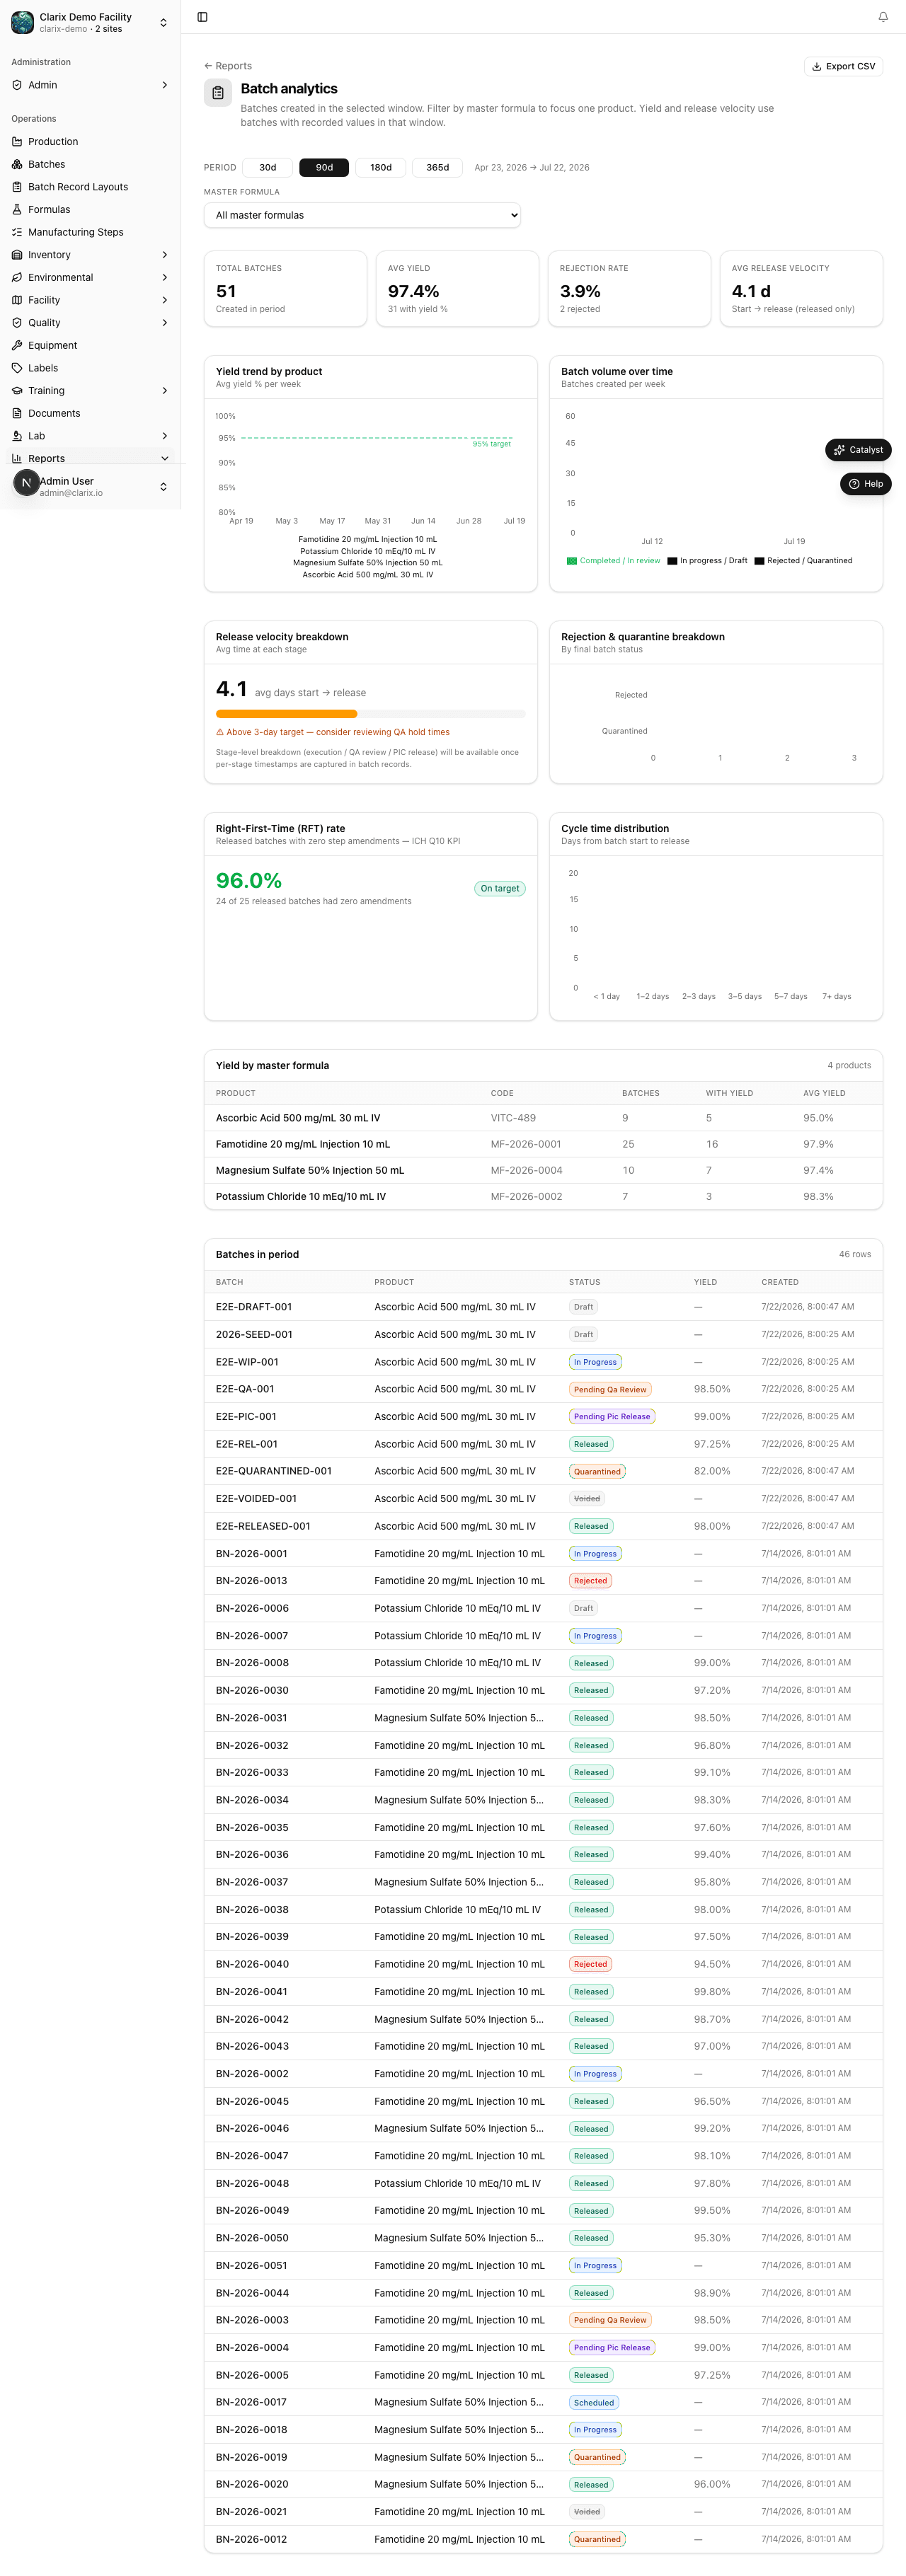
The Batch Analytics report gives your operations and quality teams a consolidated view of batch production performance over any time period. Navigate to Reports → Batch Analytics to open the report. It is designed for monthly operations reviews, leadership briefings, and trend analysis sessions where you need to quickly understand how many batches you are producing, how consistently you are hitting your yield targets, and how efficiently your QA release process is running.
Role required: QA Technician or higher. The Export CSV function is available to all users who can access the report.
What this report shows
Batch Analytics summarizes four key performance indicators across your selected date range:
Batch volume
The total number of batches completed during the period, displayed as a bar chart broken down by month. Each bar represents one calendar month and is color-coded by status — released batches in green, rejected batches in red, and batches still in QA review in amber. This chart immediately shows you whether production volume is growing, shrinking, or holding steady, and whether rejections are clustered in a particular month.
Average yield percentage
The mean yield percentage across all completed batches in the period. Yield is calculated by the Clarix formula calc engine at the time the batch is closed — it compares the actual quantity produced (in the final weighing step) against the theoretical yield defined in the formula. The average yield is displayed as a headline number at the top of the report alongside its trend (up or down) compared with the previous equivalent period.
Rejection rate
The percentage of batches that were rejected (returned to QA for investigation or formally rejected with a deviation) during the period. A rising rejection rate is a signal to investigate formula instructions, technician training, or equipment calibration. The rejection rate is shown both as a headline number and as a component of the monthly bar chart.
Release velocity
Release velocity measures the time between a batch reaching Completed status (all steps executed) and the batch being formally Released by the PIC. This metric is expressed in hours. Long release velocity times may indicate QA review bottlenecks, pending deviation investigations, or incomplete batch records. The report shows the average release velocity for the period and a distribution histogram so you can see whether delays are isolated incidents or a systemic pattern.
Filters
Use the filter bar at the top of the report to narrow the data:
- Date range — Select the start and end dates. Defaults to the past 90 days.
- Formula — Filter to a specific formula (master formula number or name). Useful when evaluating the performance of a particular product.
Filter changes apply immediately without requiring a page reload.
Charts
Volume by month bar chart
The primary chart on the report shows batch volume as a grouped bar chart with one group per month. Hover over any bar to see the exact count for that month and status combination. Click a bar to navigate to the Batch Catalog pre-filtered to that month and status.
Yield distribution histogram
Below the volume chart, a yield distribution histogram shows the spread of yield percentages across all batches in the period. The x-axis represents yield percentage in 5-point bins (80–84%, 85–89%, 90–94%, 95–99%, 100%+). The y-axis is batch count. A healthy distribution is heavily concentrated in the 95%+ range with a long tail toward lower yields. A flat or bimodal distribution may indicate systemic issues worth investigating.
Running a monthly operations review
- Navigate to Reports → Batch Analytics.
- Set the date range to the first and last day of the month you are reviewing.
- Note the headline batch volume, average yield, and rejection rate.
- Look at the yield distribution histogram. If any batches fall below 85%, hover over those histogram bars to identify the batches.
- Check the release velocity metric. If the average is above 48 hours, review the QA queue to identify what is holding up reviews.
- Click Export CSV to download the underlying data for inclusion in your monthly operations report.
Note: The CSV export includes one row per batch with columns for batch number, formula, technician, start date, completion date, release date, actual yield %, theoretical yield, release velocity hours, and final status. You can import this file directly into your monthly report template.
Related pages
503B Bulks List Monitor
Track your facility's bulk drug substances against the FDA §503B(a)(2)(A) bulks list — with live status badges, Federal Register citations, and sync updates as FDA amends the list.
Yield Analysis
Visualize yield percentage per batch as a scatter plot, identify technician and formula yield patterns, and export data for trend investigations in Clarix.