
Quality Metrics
Track deviation and CAPA counts, severity breakdowns, source analysis, and open vs. closed trends for QA review boards and corrective action effectiveness in Clarix.
The Quality Metrics report is your primary analytics tool for understanding the health of your quality management system over time. Navigate to Reports → Quality Metrics to open the report. It is designed for quarterly QA review boards, corrective action effectiveness evaluations, and annual program assessments. This report answers the fundamental quality management question: are we getting better?
Role required: QA Officer or higher. QA Managers and PICs will find this report most useful for leadership briefings and regulatory submissions.
What this report shows
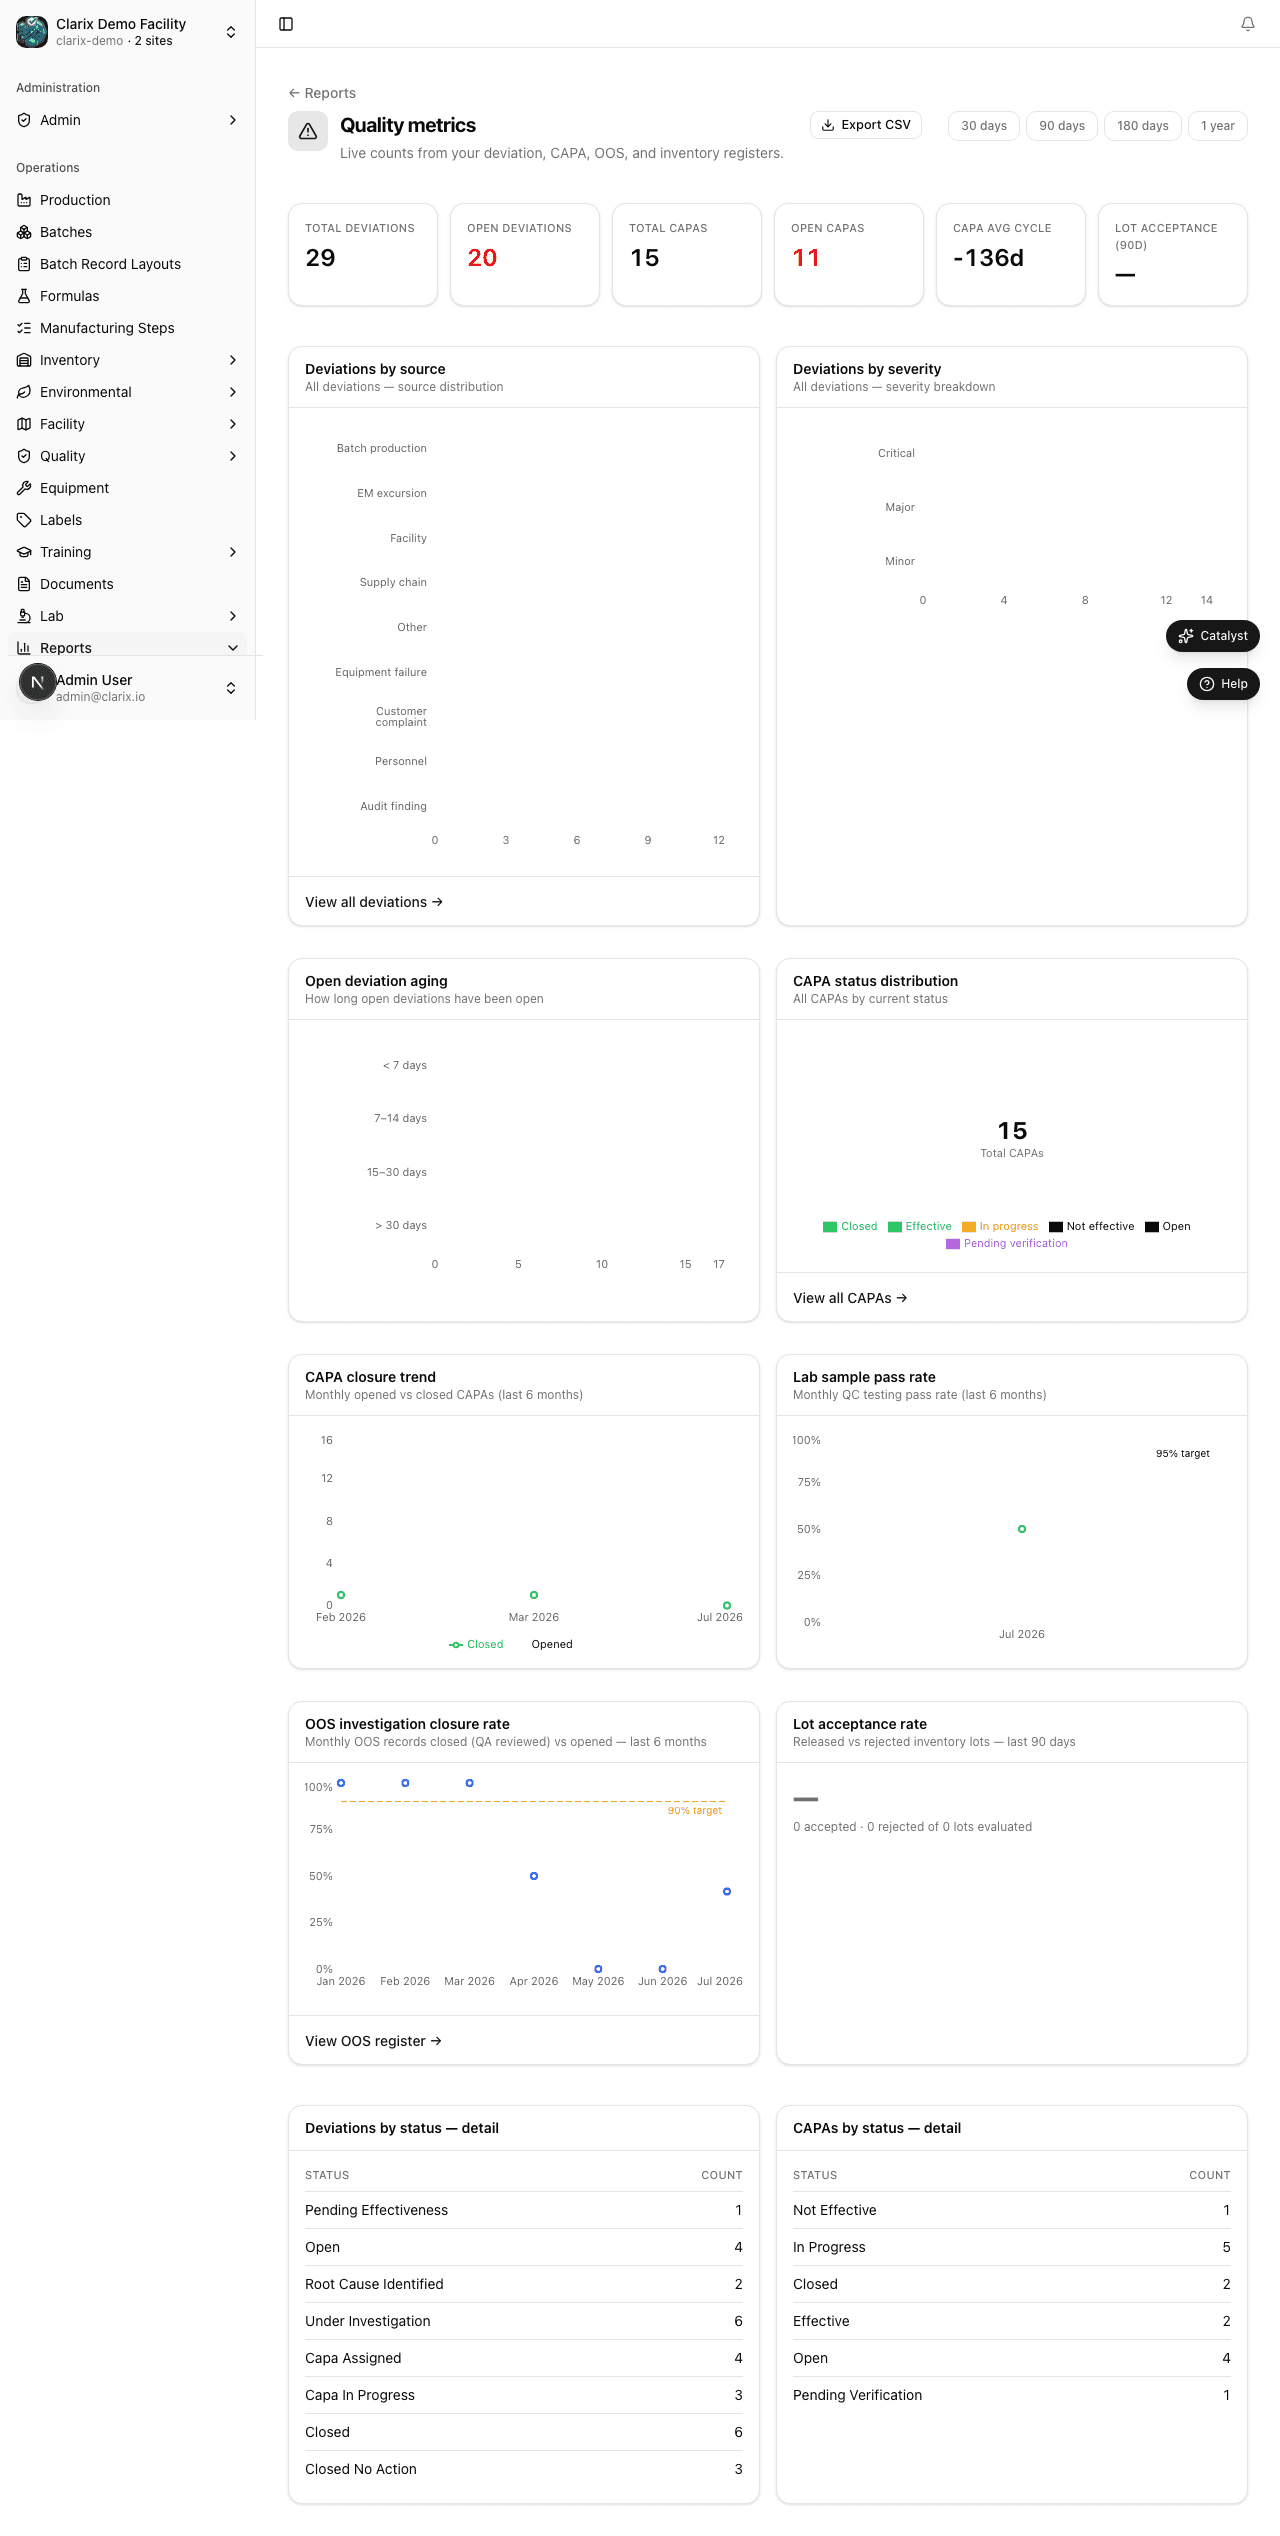
The Quality Metrics report pulls together all deviations and CAPAs created during your selected date range and presents them across several dimensions.
Deviation and CAPA counts over time
The primary time-series chart shows the number of deviations opened and CAPAs opened per month, displayed as two overlapping bar series. A healthy quality program typically shows CAPA counts that are proportional to (but lower than) deviation counts — every significant deviation should produce a CAPA, but minor deviations may not require one. If CAPA counts are consistently lower than deviation counts over multiple months, it may indicate that CAPAs are not being opened when they should be.
Breakdown by severity
A donut chart breaks down all deviations in the period by severity: Critical, Major, and Minor. The goal is a small slice of Critical deviations (ideally zero) and a manageable proportion of Major. A growing Critical slice is a signal that requires immediate leadership attention. Hover over each slice to see the exact count and percentage.
Breakdown by source
A horizontal bar chart shows deviation counts grouped by source category: Batch Production, Environmental, Equipment, Vendor/Material, Personnel, Lab, and Process. This view helps you identify which area of your operation is generating the most quality events. An equipment-heavy source breakdown may point to deferred preventive maintenance. A personnel-heavy breakdown may indicate a training gap.
Breakdown by department
Deviations are also broken down by the department assigned to the deviation record. This view is useful for internal accountability and for department-level QA reviews. Each department can see their own open items and compare their performance with peers.
Open versus closed trend
The open vs. closed trend chart shows the cumulative open deviation count over time — think of it as a quality backlog chart. If the line is trending upward, your team is opening deviations faster than you are closing them. A flat or downward-trending line indicates a healthy balance. A sharp spike followed by a decline is normal after an inspection or significant event. Use this chart as an early warning system for QA team capacity.
Filters
- Date range — Select the period to analyze. Defaults to 90 days. For quarterly review boards, set this to the full quarter.
- No additional filters are available on this report by default — the report is intentionally comprehensive to give a full picture of the quality system.
Using Quality Metrics for a quarterly QA review board
- Navigate to Reports → Quality Metrics.
- Set the date range to cover the full quarter being reviewed.
- Note the total deviation count and compare it to the prior quarter. Is volume trending up or down?
- Review the severity donut. Are there any Critical deviations that require board-level discussion?
- Look at the source breakdown. Which category contributed the most deviations? Does this point to a recurring issue?
- Check the open vs. closed trend. If the backlog is growing, discuss capacity with the QA team lead.
- Review CAPA counts. Are CAPAs being opened at an appropriate rate relative to Major and Critical deviations?
- Export the report data as a CSV for inclusion in your board meeting minutes.
Note: For FDA inspections, investigators frequently ask for evidence of CAPA effectiveness — specifically, whether deviations that recur after a CAPA was closed are being tracked. Clarix does not currently auto-detect recurrence, but you can use the source breakdown and deviation detail records to manually verify whether a root cause was truly corrected. Document this analysis in the CAPA closure record.
Corrective action effectiveness
The Quality Metrics report does not directly measure whether a CAPA worked — that judgment requires human review of specific evidence. However, you can use the report as a proxy: if a particular source category (e.g., Equipment) shows a sharp decline in deviation counts after a CAPA was closed in that area, that is supporting evidence of effectiveness. Capture this observation in the CAPA closure note and link it to this report's export for the relevant period.
Related pages
Yield Analysis
Visualize yield percentage per batch as a scatter plot, identify technician and formula yield patterns, and export data for trend investigations in Clarix.
483 Readiness
The pre-inspection checklist report for 503B facilities — a radar chart of readiness scores across all regulated domains, with a PDF export for FDA investigators.